Das Abonnement beinhaltet
Support
Most WooCommerce store owners track revenue. Very few track actual profit. The gap between the two — product costs, payment gateway fees, shipping expenses, packaging, and overhead — is exactly where money silently disappears.
QuarkCode Neural Commerce closes that gap. It gives you a clear, real-time picture of what you actually keep after every sale, and tells you what to do about it.
What you get from day one:
True Net Profit Tracking
Revenue numbers look good on paper, but they do not tell you whether you are actually making money. Neural Commerce factors in your Cost of Goods Sold (COGS), WooCommerce shipping costs, payment gateway fees (Stripe, PayPal, and others), and any custom overhead rules you define — so every profit figure shown is accurate, not estimated.
Profitability is tracked at the order level, product level, category level, and customer level, all visible from a single dashboard with real-time charts.
Cost Management That Fits How You Work
Enter product costs manually for individual products and variations, or import them in bulk via CSV if you have a large catalog. Neural Commerce supports variable products, meaning you can set a different cost for every individual variation.
Beyond basic COGS, you can define custom cost rules — a fixed packaging fee per order, a percentage-based labor cost, a warehousing charge — and the plugin applies them automatically across your calculations. Historical cost tracking means you can see how your margins have changed over time as supplier prices shift.
AI-Powered Profit Insights
Neural Commerce integrates with Gemini and Perplexity AI to bring predictive analytics directly into your store admin. Instead of only looking at what happened, you can ask what is likely to happen next.
The AI layer covers profit forecasting, natural language data queries, and anomaly detection — so if costs spike unexpectedly or a product’s margin collapses, the system flags it before it becomes a pattern. All data processing for AI features happens using only the context required, and your full sales data is never shared.
Customer Lifetime Value (CLV)
Not all customers are equal. Neural Commerce calculates the true lifetime value of every customer — accounting for their purchase history, average margins, and order frequency. Customers are automatically segmented into tiers (VIP, Loyal, New, At-Risk), and cohort analysis shows how retention rates change over time. This tells you which customers are genuinely worth retaining and which promotional efforts are costing more than they return.
Dead Stock and Inventory Intelligence
Capital sitting in unsold inventory is capital that is not working. The Dead Stock Analyzer identifies products that have not moved in a defined period, calculates how much cash they are tying up based on real COGS, and surfaces them in a dedicated dashboard view. Slow-moving inventory alerts can also be configured to notify you automatically.
Automated Margin Alerts
Neural Commerce monitors your store continuously and notifies you when something needs attention. Configurable alerts cover:
Alerts are delivered by email, and the digest timing (hourly or daily) is fully configurable from the settings panel.
Built for Performance and Security
All analytics data is stored in dedicated custom database tables, separate from WooCommerce’s core tables, to keep queries fast without slowing down your storefront. Data processing runs asynchronously in the background. The plugin follows WordPress security standards throughout: SQL injection prevention, XSS protection, CSRF token validation, and admin-only role-based access.
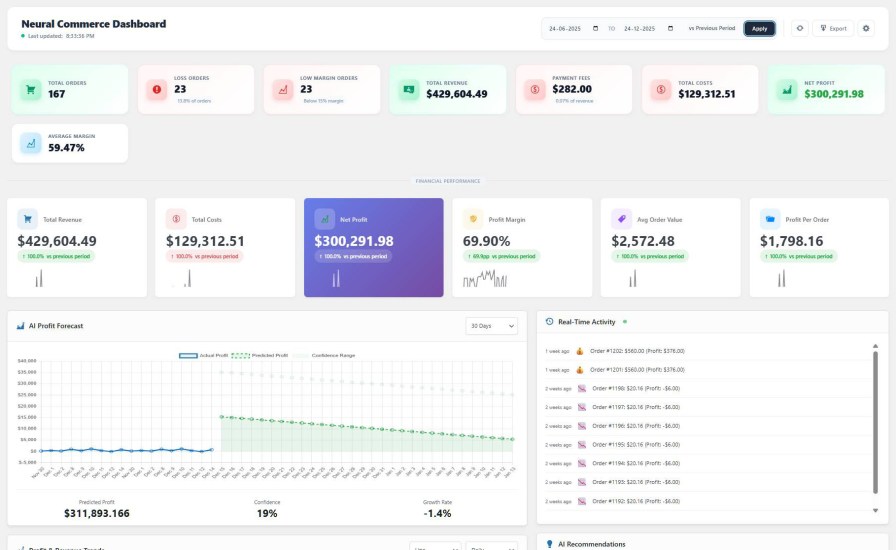
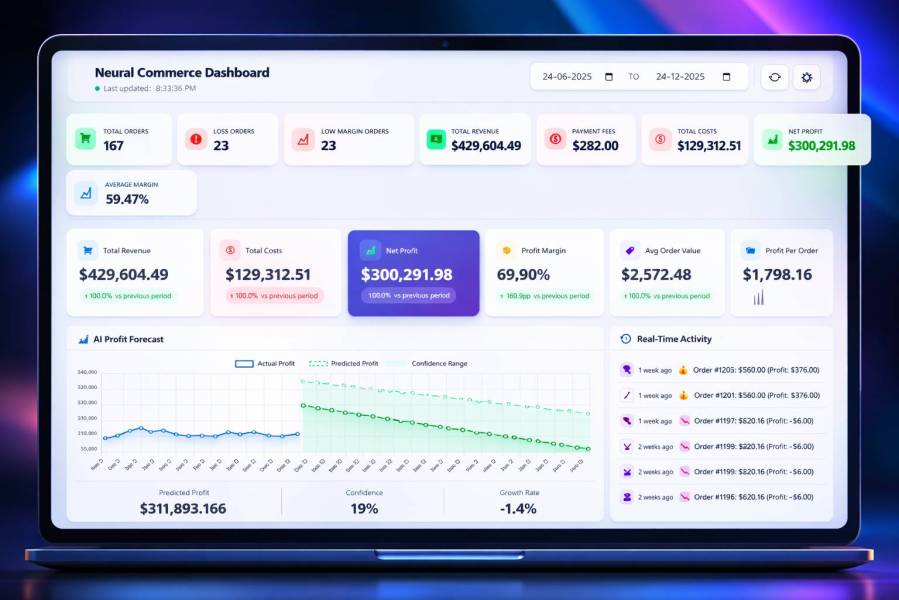
The Neural Commerce Dashboard puts your most critical numbers front and center the moment you log in. Net Profit, Margin %, Total Revenue, and Order Count are displayed as live KPI cards — no digging through reports. A real-time activity chart shows your profit pulse as it happens, and an AI Forecast panel on the right shows where your numbers are heading, not just where they’ve been. For store owners who are tired of guessing whether today was actually a good day, this screen answers that in seconds.
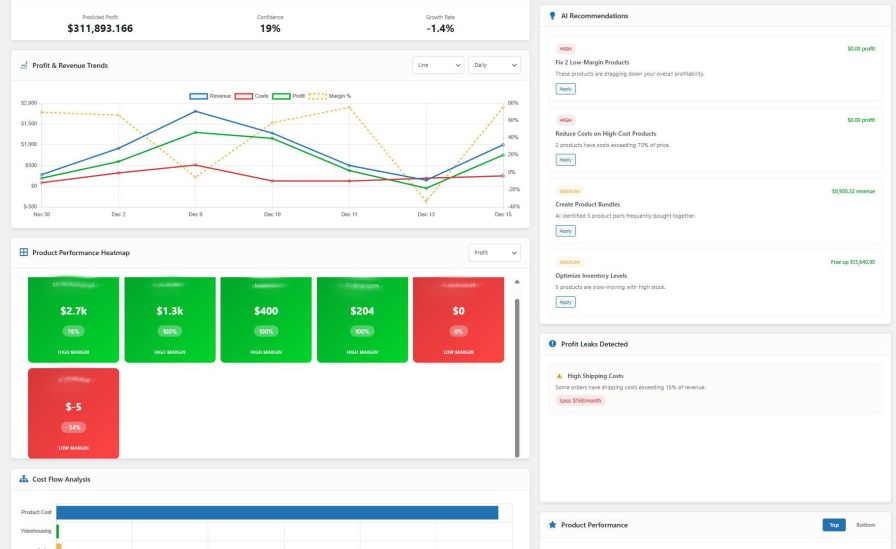
This view overlays your Revenue vs. Net Profit trends on a single timeline chart, making it immediately obvious when revenue grows but profit doesn’t — a classic sign of rising costs or margin erosion. Supporting KPI cards break down Payment Fees, COGS, and Shipping Costs so you can see exactly where money is leaking. Most WooCommerce analytics tools show you revenue. This shows you the gap.
Neural Commerce automatically ranks your products by profit contribution, showing both your top 10 most profitable and worst 10 loss-makers side by side. No pivot tables, no exports — the dashboard surfaces which products are silently draining margins so you can act immediately. The summary panel below consolidates total COGS, fees, and net profit into a single snapshot for quick daily review.
It also provides an AI Insights regarding the performance of your store.
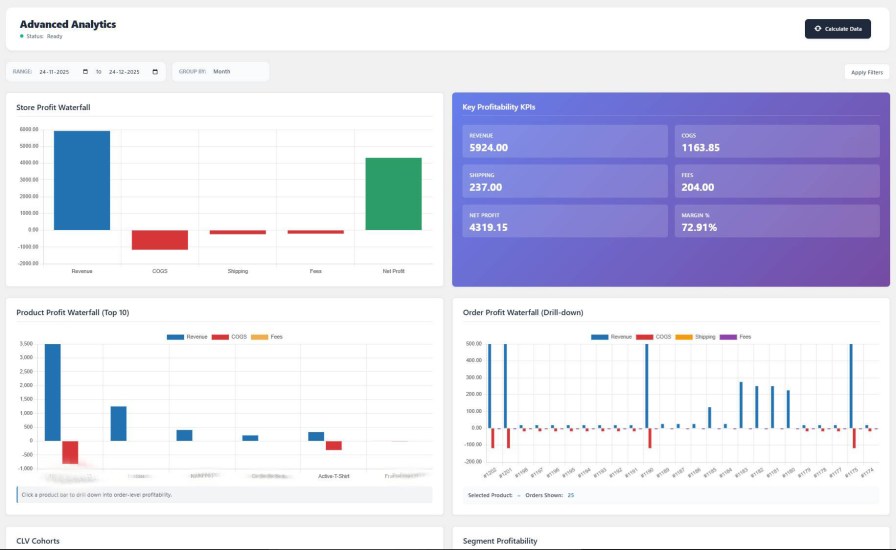
The Advanced Analytics screen gives you profitability at three levels simultaneously: your entire store, individual products, and per-order. Each level is displayed as its own bar chart so you can compare scale — a product might look profitable in isolation but represent a small share of total store profit. Negative-value bars are shown clearly in a contrasting color, making loss-making products impossible to miss. This is the screen that tells you not just what sold, but what was actually worth selling.
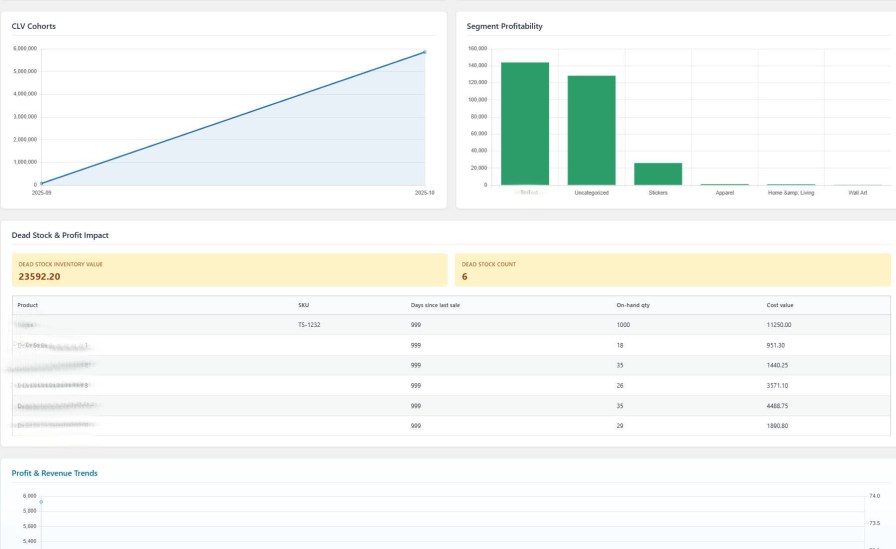
This is one of the most data-dense screens in the plugin, combining four views in a clean layout: a revenue trend line chart with area fill showing momentum over time, a segment profitability bar chart breaking down profit by customer tier (VIP, Loyal, New), a customer profitability ranking, and a detailed revenue breakdown table. Store owners running promotions or loyalty campaigns will see immediately which customer segments are generating real profit versus which ones are being acquired at a loss. Values are displayed in consistent units (thousands), making cross-comparison fast and accurate.
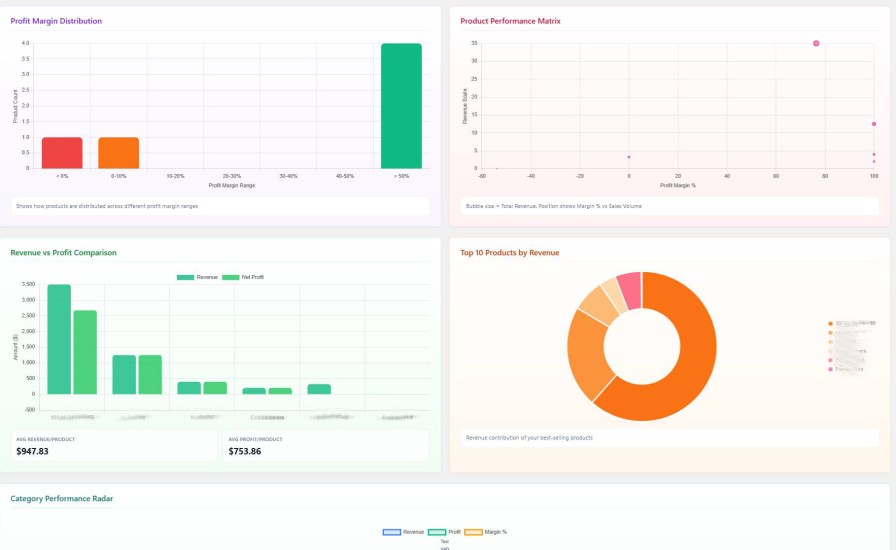
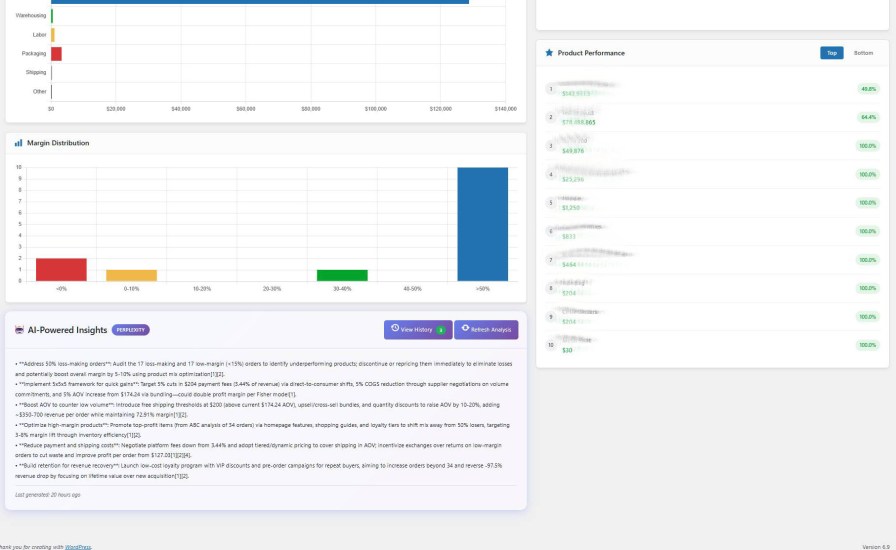
This four-panel analytics view gives a category-level and revenue distribution overview of your store using bar charts, a column chart, and a pie chart. It answers strategic questions like which product categories contribute the most to revenue, how that revenue is distributed across your catalog, and which individual products sit at the top of the performance ladder. Use it to spot which categories deserve more investment and which are diluting your overall store margins.
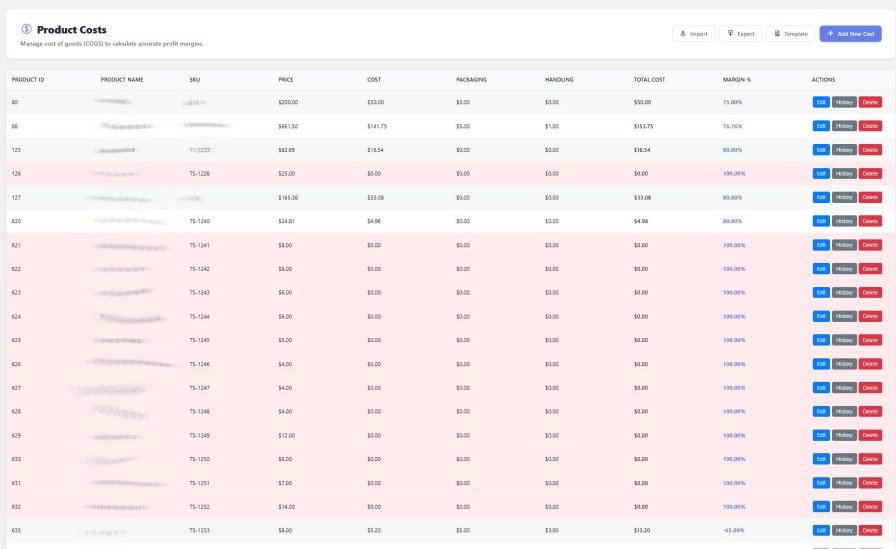
The Product Costs screen is where accurate profit calculations start. Each product row shows its selling price, COGS, handling costs, packaging, and labor — all editable inline. Color-coded highlights flag products where cost data is missing or where margins are dangerously thin. Without accurate COGS entered here, no profit figure in any dashboard is trustworthy. This screen makes it easy to keep that data clean, current, and complete across your entire catalog.
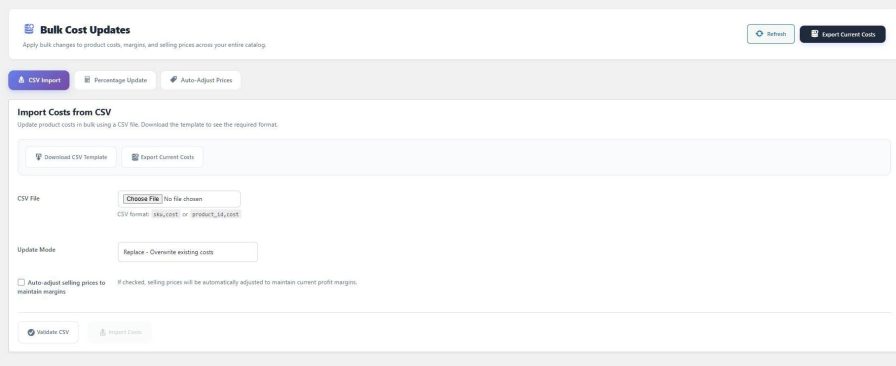
When a supplier raises prices, manually updating costs product by product is not an option at scale. The Bulk Cost Update screen lets you import a CSV to update COGS across your entire catalog in one action, apply a percentage-based cost increase store-wide, or run a supplier-wide cost update for a specific brand or category. A preview step shows you exactly what will change before anything is saved. What used to take hours of spreadsheet work becomes a two-minute task.
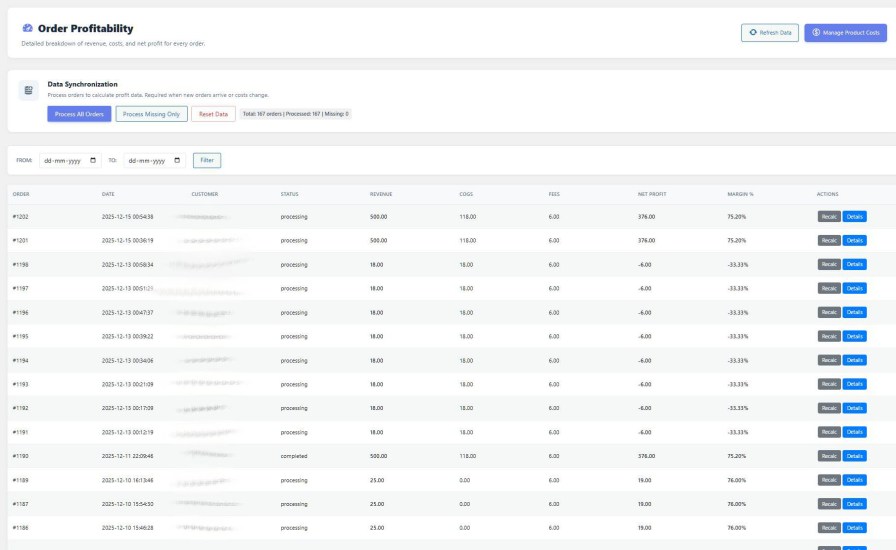
The Order Profitability screen lists every order with its full cost breakdown: Revenue, COGS, Shipping, Payment Fees, and Net Profit — all in one row. You can filter by date range or order status to isolate refund-heavy periods, promotion windows, or high-fee gateways. This is the screen that reveals loss-making orders the moment they happen — not at month-end when it’s too late to act. Clicking into any order gives you a line-by-line profit waterfall from sale price down to the final net.
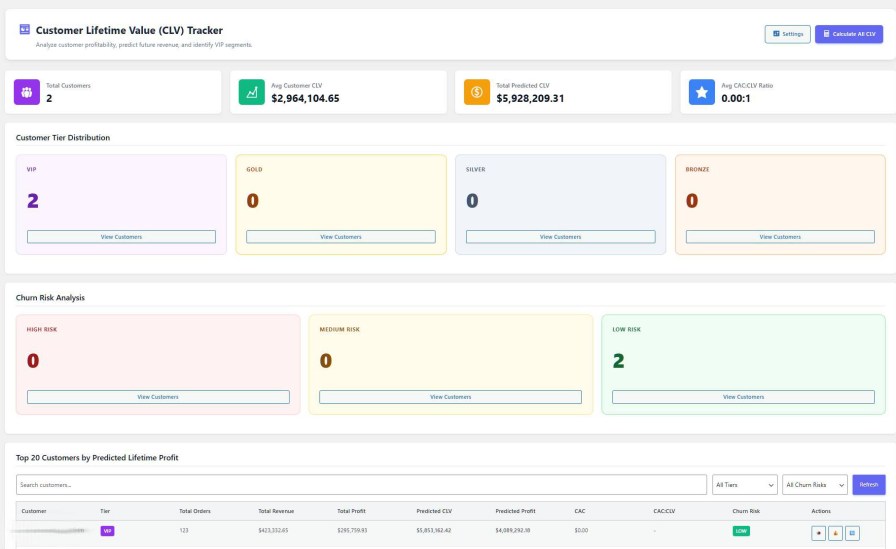
The Customer Lifetime Value dashboard segments your entire customer base automatically into tiers — VIP, Loyal, New, and At-Risk — based on real purchase history and profit contribution. The Churn Risk panel identifies customers showing signs of disengagement before they leave. The top 20 customers by predicted lifetime profit are listed with their current CLV, order history, and risk score. This turns your customer list from a headcount into a ranked asset — so you invest retention efforts where they generate the highest return.
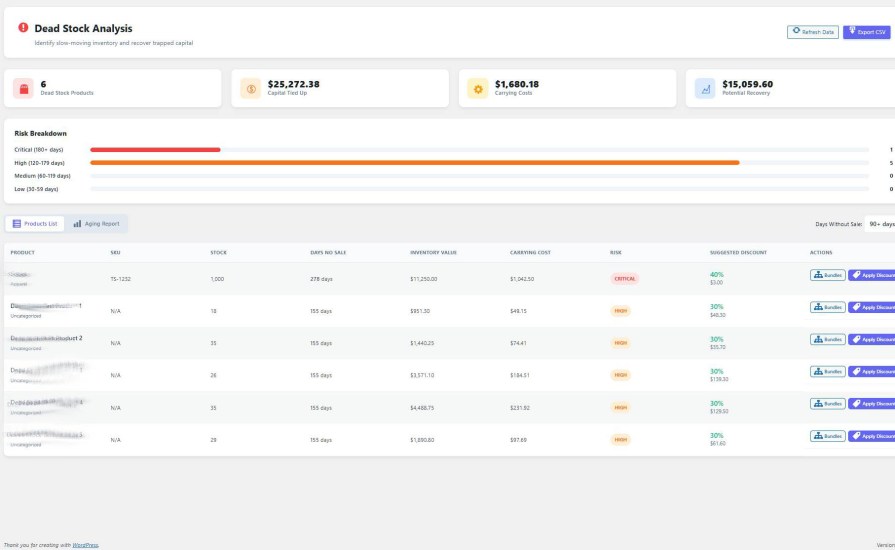
The Dead Stock Analyzer identifies products that haven’t sold within a configurable time window and calculates exactly how much capital they are tying up — based on your real COGS, not guesswork. Products are color-coded by risk level: critical (red), warning (yellow), and healthy (green), so you can prioritize clearance or bundling decisions at a glance. The summary KPIs at the top show total dead stock value and inventory aging distribution. Reclaiming that capital can directly fund better-performing inventory.
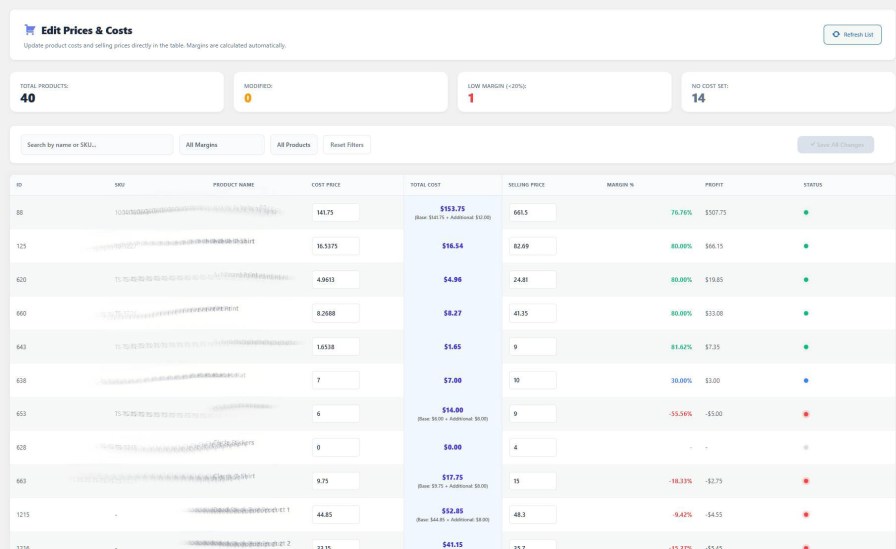
The Inline Price Editor shows your product’s current price, COGS, and resulting margin in the same row — so every price change you make is an informed one, not a guess. You can edit selling prices directly in the table without navigating to individual product pages. The highlighted margin column updates instantly as you type, making it easy to hit a target margin across multiple products at once. For stores running seasonal pricing or responding to cost increases, this screen removes the risk of accidentally pricing below cost.
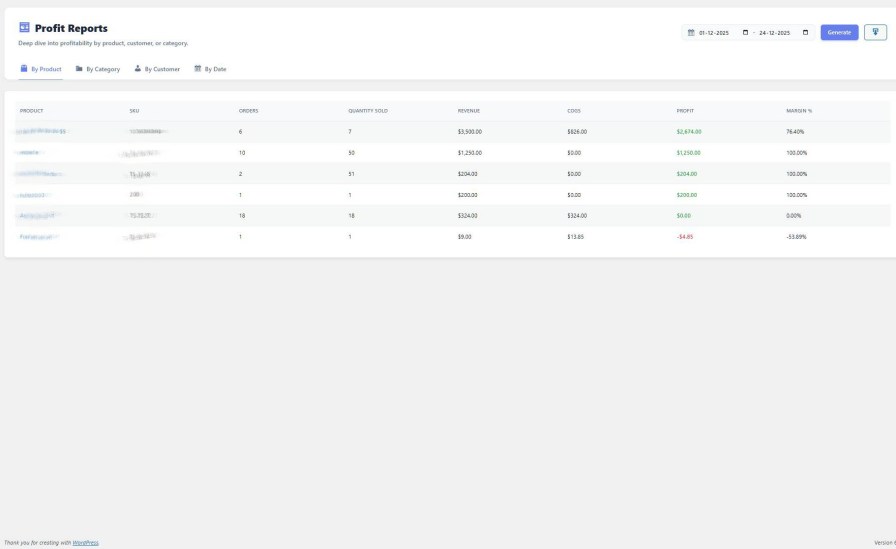
The Profit Reports screen generates detailed profitability breakdowns filtered by any dimension — Product, Category, Customer, or Date range. Each report shows Revenue, COGS, Fees, Net Profit, and Margin % in a clean table that can be exported to CSV for accounting, investor reporting, or supplier negotiations. The filter-and-generate workflow is fast and straightforward, so you spend time acting on the data rather than extracting it.
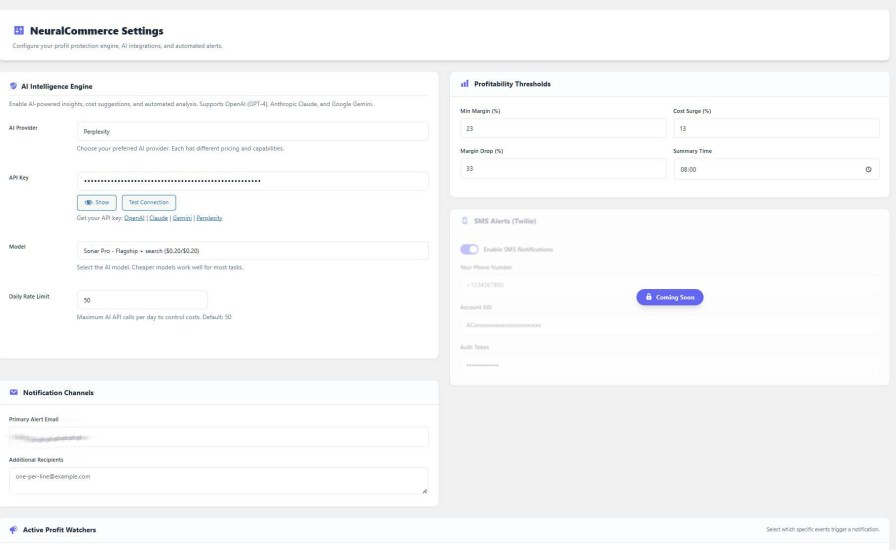
The Settings panel puts complete configuration in one organized screen — no hunting across multiple admin pages. You can configure payment gateway fee structures (fixed, percentage, or both), set minimum margin thresholds for alerts, choose your AI provider and API key, control email digest timing, and manage notification channels including email. Every behavior of the plugin — how it calculates, when it alerts, and how it communicates — is controlled from here. It is built for the store owner who wants precision, not defaults.
Yes. You can set a different Cost of Goods Sold (COGS) and custom handling fee for every individual variation of a product, so your profit figures stay accurate even across a large variable catalog.
Net Profit = Total Sale Price minus (COGS + Shipping Costs + Payment Gateway Fees + Custom Overhead Rules + Applicable Taxes). Every element is configurable, and the formula is applied per order in real time.
Yes. Neural Commerce includes a CSV import tool that lets you upload product costs in bulk. You can also apply percentage-based cost updates across your entire catalog from the Bulk Cost Update screen.
The plugin includes a payment gateway integration layer that automatically captures transaction fees from popular gateways including Stripe and PayPal, so those fees are reflected in your profit calculations without manual entry.
No. All analytics processing uses dedicated custom database tables and runs asynchronously in the background. Your frontend store pages are not affected. The plugin is designed specifically to avoid adding overhead to customer-facing load times.
Margin Alerts are automated email notifications triggered when your profit margin on an order or product falls below a threshold you define. You configure thresholds, alert types (margin drop, unprofitable order, cost increase, daily digest), and delivery timing in NeuralCommerce > Settings > Email Alerts.
The AI insights features integrate with Gemini and Perplexity AI. To use them, you will need API keys from the respective providers. The core profit analytics, cost management, alerts, and reporting features work fully without any AI provider connection.
All analytics data is stored locally on your own WordPress database server and is never transmitted to external servers. If you choose to use AI features, only the specific context required for that query is sent to the AI provider, subject to their privacy policy. No full sales exports or customer data are shared automatically.
Yes. Neural Commerce declares full compatibility with WooCommerce HPOS (custom order tables), so it works correctly whether you are using legacy post-based orders or the modern order storage system.
Quality Checks
Länder