
L’abonnement comprend
Assistance
Customer Analytics for WooCommerce shows you who your best customers are, which ones are slipping away, and what each customer is worth — from the order data already in your store.
While WooCommerce provides basic sales reports, decisions about retention, marketing spend, and outreach need deeper customer metrics. Customer Analytics for WooCommerce adds dedicated reports for RFM customer segments, top customers with predicted next-order dates, customer lifetime value, active customer value, cohort retention, repeat purchase rate, churn rate, acquisition sources, and geographic performance — plus one-click coupon creation for a chosen segment — all within the native WooCommerce Admin interface.
Unlike traffic analytics tools, Customer Analytics for WooCommerce reveals customer behavior patterns through metrics built for retention analysis. It extends your existing WooCommerce Analytics dashboard without requiring external services or third-party data sharing.
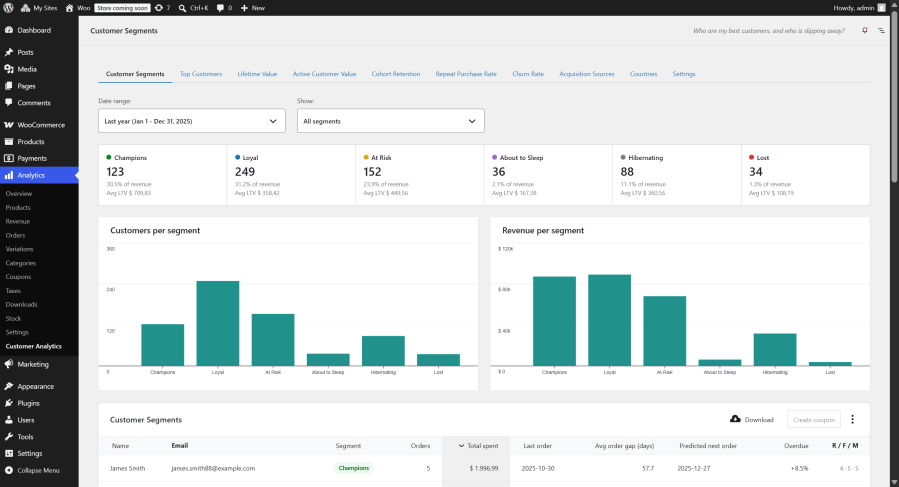
Who are my best customers, and who is slipping away?
Group your customers into actionable segments using RFM analysis (Recency, Frequency, Monetary), then act on them directly. Every customer is scored 1–5 on how recently they ordered, how often they buy, and how much they spend, and mapped to one of six named segments — so you can see who your best customers are and who needs winning back.
Key Features:
Example: Create a win-back coupon for your « At Risk » segment in one click to re-engage previously valuable customers before they churn.
Which of my customers are worth the most, and which are overdue for their next order?
See who your most valuable customers are — ever, or as of any date in the past. The report ranks customers by lifetime value in a leaderboard, shows how lifetime spend is distributed across your customer base in an LTV histogram, and predicts each customer’s next order from their own buying rhythm.
Key Features:
Example: Sort the leaderboard by « Overdue » to find high-value customers who are past their usual buying rhythm — the exact list to reach out to this week.
What is an average customer worth over their lifetime?
Track average revenue per customer across your entire store, segmented by time periods and customer behavior patterns. The customer lifetime value WooCommerce report helps you understand the long-term profitability of different customer segments.
Key Features:
Example: If your average customer lifetime value is $200 and acquisition costs $50, that is a 4x return — context you need before scaling marketing spend.
How many of my customers are still active, and what are they worth on average?
Track the size and value of your active customer base over time. At each interval the report measures the customers who were active within your churn period — how many there are and the average value per active customer — so the trend reflects your currently-engaged base instead of a flat all-time average.
Key Features:
Example: Use trend data to correlate changes in customer value with marketing campaigns, product launches, or seasonal patterns.
What share of each month’s new customers keeps buying in later months?
See how well you retain the customers you acquire, month by month. Each row of the cohort retention heatmap is a monthly cohort — the customers whose first order fell in that month — and each cell shows the percentage of that cohort who placed at least one order N months later, shaded so retention patterns stand out at a glance.
Key Features:
Example: If retention collapses after M+1 across every cohort, a post-purchase email at the 30-day mark targets exactly where customers are slipping away — and the following cohorts’ rows show whether it worked.
What percentage of my customers order more than once in the same period?
Track the percentage of customers who return for additional purchases across customizable time periods. The repeat purchase rate WooCommerce report helps identify whether customer retention efforts are working.
Key Features:
Example: A rising repeat purchase rate indicates improving customer retention without additional acquisition costs.
What percentage of my active customers stop buying during a period?
Monitor customer attrition with configurable detection periods tailored to your business cycle. The WooCommerce churn rate report measures the percentage of active customers lost in each period — customers lost during a period divided by customers active at its start — so you can see when customers stop purchasing and act on that data.
Churn Detection Periods:
Example: Tracking churn rate over time lets you measure whether retention campaigns are reducing customer attrition.
Which marketing channels bring customers who come back?
See which marketing channels bring customers who come back — not just customers who convert once. Every customer is attributed to the channel of their first order, using WooCommerce’s built-in order attribution data, and the report then measures what those customers went on to be worth.
Key Features:
Example: The channel that acquires the most customers is often not the one that acquires the most valuable ones — comparing lifetime value per source tells you which campaign deserves the next increase in budget.
Which countries bring the most sales, and what do they buy?
Analyze geographic performance with detailed country-level metrics that go beyond basic location reports.
Key Metrics by Country:
Example: Identify top-performing products by country to optimize inventory allocation and marketing for each market.
The plugin integrates directly with your WooCommerce Admin dashboard:
Built to WordPress coding standards and optimized for WooCommerce’s High-Performance Order Storage (HPOS) system. The plugin is HPOS compatible and designed for stores running modern infrastructure.
Requirements:
Performance Features:
Customer Analytics for WooCommerce works with the order history you already have: install it, open the Analytics menu, and the reports are populated from your existing data — no tracking scripts to add and no accounts to create. Everything is computed and stored on your own server.
The WooCommerce Customer Analytics extension adds customer-focused metrics to your store: RFM customer segments, customer lifetime value (CLV), a top-customers leaderboard with predicted next-order dates, cohort retention, churn rate, repeat purchase rate, acquisition sources, and geographic sales. It extends WooCommerce's built-in Analytics with these as new WooCommerce reports under WooCommerce → Analytics, computed from your existing order data — without replacing or removing any native report.
Google Analytics focuses on traffic and acquisition sources; Customer Analytics focuses on customer behavior — lifetime value, customer retention, churn rate, and RFM segmentation — using the order data already in your WooCommerce database. It runs entirely on your server for privacy-first customer insights, with no tracking script and no data sent to any third-party service.
No. Customer Analytics works on the orders already in your store, so reports are populated immediately on activation. There is no tracking snippet to add and no waiting period before the data starts collecting — your full order history is analyzed from day one.
No. The plugin adds no front-end tracking script and runs its queries only when you open a report in the admin, reading from WooCommerce's High-Performance Order Storage. For very large stores you can set a lookback period to limit how much history each report processes.
RFM segmentation scores each customer 1–5 on Recency (how recently they ordered), Frequency (how often they order), and Monetary value (how much they spend). Scores use quintiles by default, or fixed thresholds you set. Customers map to six named segments — Champions (your best, highest-value customers), Loyal, At Risk, About to Sleep, Hibernating, and Lost — and a sortable table ranks individual customers by total spent.
From the Customer Segments report, select a segment and click Create coupon. The plugin generates a standard WooCommerce coupon restricted to that segment's customer email addresses, limited to one use per customer — ideal for win-back campaigns. You set the discount type, amount, expiry date, and code, then a link takes you straight to the coupon editor.
Customer lifetime value (CLV) is the average net revenue a customer generates across their whole relationship with your store. The plugin groups every order by customer (guests by billing email), subtracts refunds to match WooCommerce's revenue, and averages across customers.
The Top Customers report ranks your customers by lifetime value: a leaderboard with each customer's orders, average order value, lifetime spend, last order, and predicted next order, plus an LTV distribution histogram showing how many customers fall into each lifetime-spend bracket and summary cards (total customers, average and median LTV, total LTV, top customer). The date range selects which acquired customers appear (those whose first order falls in the range), and a "Values as of" filter can pin all values to a past date — so you can also see who your top customers were at the end of last year.
The predicted next order date comes from each customer's own buying rhythm. Their average order gap is the time from first to last order divided by the number of gaps between orders, and the predicted next order is one average gap after their last order. The Overdue column shows how far past that prediction they are, as a percentage of their own gap — so you can sort a segment by "most overdue versus their own pattern". The prediction needs at least two orders; one-time buyers show a dash. These columns appear in both the Customer Segments and Top Customers reports.
It shows which marketing channels bring customers who come back. Each customer is attributed to the channel of their first order — using the order attribution data WooCommerce already records — and the report then reports that group's lifetime value, repeat rate, orders per customer, average order value, still-active share, and first-order revenue against lifetime revenue. You can group by channel (organic, paid, referral, direct and so on) or by utm source, medium, or campaign. WooCommerce's own attribution report is order-level and answers which channel made a sale; this one answers what the customers that channel brought turned out to be worth.
Because their first order carries no attribution data. WooCommerce records the source of an order only while its Order Attribution feature is active, so orders placed before that — including your older order history — have none, and orders placed through the admin are recorded as such. When only a small share of the customers in range carry attribution data, the report displays a notice stating that share, so an "Unknown" row is never mistaken for a fault.
The Cohort Retention report groups customers into monthly cohorts by the month of their first order and shows, for each cohort, the percentage who placed at least one order 1, 2, 3… months later — as a shaded heatmap with the cohort size alongside. An accompanying chart averages retention across cohorts at each month offset so you can see where the typical drop-off happens, and the whole matrix can be exported as CSV.
A customer is counted as churned in a period if they were active at its start (they had ordered within your churn window, default 90 days) but placed no order by the period's end. You can set churn windows from 15 days up to 2 years to match your purchase cycle.
Repeat purchase rate is repeat customers ÷ total customers × 100, measured per period. A customer counts as "repeat" when they placed two or more orders within the period.
Yes. The Countries report breaks down items sold, net sales, and orders by billing country, with all-countries, single-country, and side-by-side comparison views. This geographic sales report's net sales are calculated on the same net basis as WooCommerce's native Revenue, Products, and Categories reports.
It depends on the report. The value reports (Lifetime Value, Active Customer Value, Countries, Top Customers, Acquisition Sources, RFM monetary value) subtract refunds to match WooCommerce's native revenue. The behavioral reports (Churn Rate, Repeat Purchase Rate, Cohort Retention) exclude fully refunded orders, since a refund isn't a real purchase.
Yes. Guest orders are grouped by their billing email address so each customer is counted consistently across reports.
Yes. Subscription orders from WooCommerce Subscriptions are included in the calculations like regular orders.
Reports always use current data from your WooCommerce database, so each report reflects your orders as they are at the time you view it.
No. All calculations run on your own server using data already in your WooCommerce database. There are no external dependencies and no customer data is shared with third parties.
Yes. The plugin reads order data from WooCommerce's High-Performance Order Storage (HPOS), so HPOS must be enabled. It also needs current versions of WordPress, WooCommerce, PHP, and MySQL — see the Requirements section on this page for the exact minimums.
Yes. Every report includes a CSV download. The Customer Segments export includes each customer's email address and segment, which is useful for external analysis or marketing tools.
Informations sur l'extension
Vérifications qualité
Pays