
Overview
↑ Back to topCustomer Analytics for WooCommerce is a powerful analytics extension that provides advanced customer metrics and insights beyond standard WooCommerce reporting. It opens on an Overview dashboard that answers how your customer base is doing and what changed this period, and that you can print or save as a PDF. Behind it, it helps store owners track RFM customer segments, top customers with predicted next-order dates, customer lifetime value, active customer value, cohort retention, repeat purchase rates, the order sequence customers follow and the time between their orders, churn rates, acquisition sources, and customer value by country to make data-driven decisions about their business. Every report can be segmented by WordPress user role, by product category and, on stores selling in more than one currency, by currency.
Key benefits
↑ Back to top- Start With What Changed: An Overview dashboard gathers the headline figure from every report, flags what moved enough to act on, and links through to the detail
- Share Your Numbers: Print the Overview dashboard or save it as a PDF, headed with your store name, logo, web address and date range
- Understand Customer Value: Track lifetime value metrics to identify your most valuable customer segments
- Monitor Customer Retention: Measure repeat purchase rates and churn to optimize retention strategies
- Geographic Insights: Analyze sales performance by country to optimize international strategies
- Flexible Reporting: Filter data by date range, WordPress user role, product category and currency, as well as by customer segment and behavior pattern
- Targeted Marketing: Group customers into RFM segments and create coupons in one click, for a whole segment or for the individual customers you pick
- Measure Acquisition Quality: Compare lifetime value and repeat rate by the marketing channel that acquired each customer
- Data Export: Export reports for external analysis and presentation
Requirements
↑ Back to top- WordPress: 6.9 or higher
- WooCommerce: 9.0 or higher
- WooCommerce HPOS: High-Performance Order Storage must be enabled
- WooCommerce Analytics: The WooCommerce Analytics feature must be enabled (WooCommerce → Settings → Advanced → Features → WooCommerce Analytics)
- PHP: 7.4 or higher
- Database: MySQL 8.0 or higher, or MariaDB 10.6 or higher
- Browser: Modern browser with JavaScript enabled
Installation guide
↑ Back to topStep-by-step installation
↑ Back to top- Download the Plugin: obtain the
customer-analytics.zipfile from your purchase receipt or download area - Upload to WordPress: navigate to WordPress Admin → Plugins → Add New, click “Upload Plugin”, choose the downloaded ZIP file, and click “Install Now”
- Activate the Plugin: after installation completes, click “Activate Plugin”. Alternatively, go to Plugins → Installed Plugins and activate Customer Analytics
- Verify HPOS is Enabled: go to WooCommerce → Settings → Advanced → Features and make sure that “High-performance order storage (recommended)” is selected under “Order data storage”. Don’t forget to save the settings.
- Verify WooCommerce Analytics is Enabled: go to WooCommerce → Settings → Advanced → Features and ensure that “WooCommerce Analytics” is enabled. Customer Analytics adds its reports under the WooCommerce Analytics menu, so this feature must be on for the plugin’s pages to appear. Save the settings.
- Import Historical Data (only if your store has older orders): WooCommerce Analytics keeps its own lookup tables, and every report in Customer Analytics reads from them. Orders placed through normal checkout while WooCommerce Analytics was active are recorded automatically and need no import. Orders that predate WooCommerce Analytics, or that were added by a migration, a CSV import, or a database copy from another site, are missing from those tables until you import them. To check, open WooCommerce → Analytics → Revenue for a period you know contains orders: if it is empty, the data was never imported. In that case go to WooCommerce → Analytics → Settings, find the “Import historical data” section, choose “All” as the date range and start the import. This is a one-time step.
- Initial Configuration: navigate to WooCommerce → Analytics → Customer Analytics → Settings tab and review the churn period, the customer segmentation thresholds and the Active Customer Value lookback period. Each of these ships with a working default, so changing them is optional. Exchange rates are the exception and have no default. If your store has taken orders in more than one currency, reports cannot combine those currencies until every one of them has a rate, so they fall back to showing your store currency’s orders on their own and the rest of your orders are left out of the default view. Enter a rate for each currency, then save your settings
Troubleshooting installation issues
↑ Back to top- Plugin doesn’t appear after activation: Clear your browser cache and WordPress cache
- Missing menu items: Ensure your user role has the
manage_woocommercecapability - JavaScript errors: Check for plugin conflicts by temporarily disabling other plugins
Features & metrics
↑ Back to topOverview dashboard
↑ Back to topHow is my customer base doing, and what changed this period?
Location: WooCommerce → Analytics → Customer Analytics (the Overview tab, which the menu entry opens)
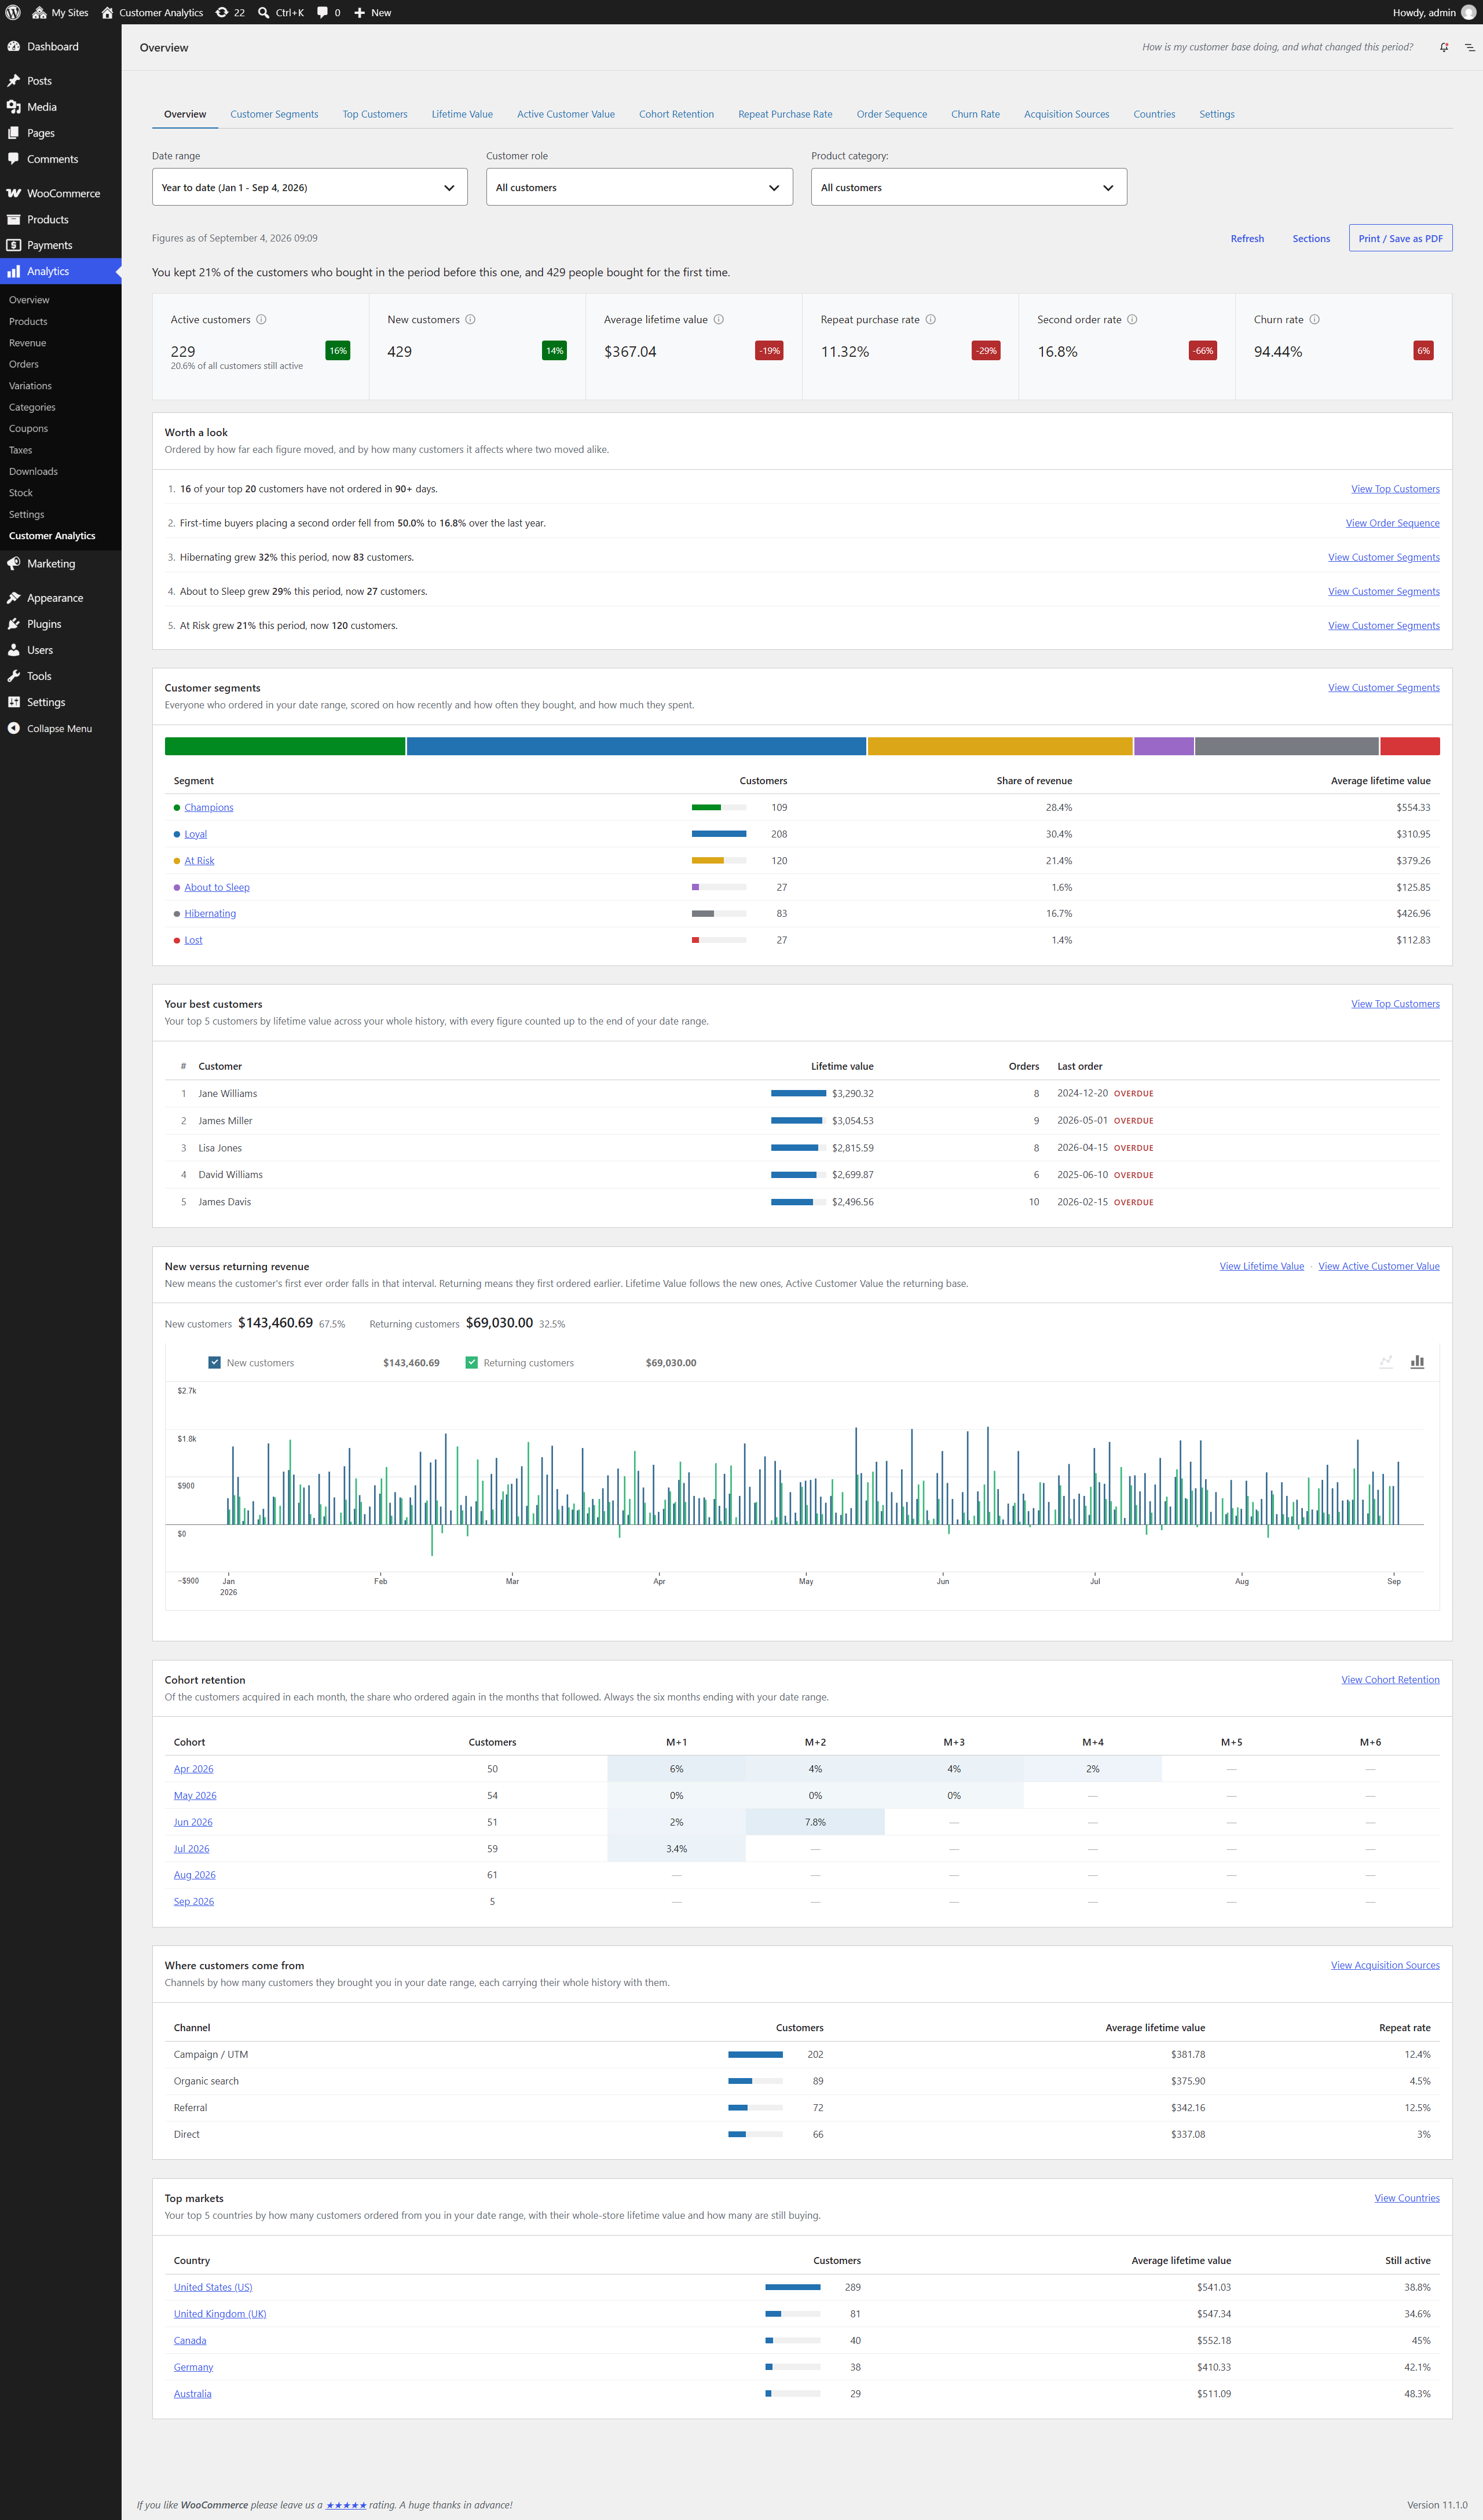
The screen Customer Analytics opens on. It gathers the headline figure from every report onto one page, points out which of them moved enough this period to deserve your attention, and links through to the report behind each one. Every figure on it is computed by the same code as the report it links to, so a number here and the same number there always agree. The plain sentence at the top of the page is the one exception, because the retention share it quotes is not a figure any single report produces.
What the dashboard shows
- A plain sentence above the figures, stating the period’s most important true fact, such as what share of last period’s customers you kept and how many people bought for the first time
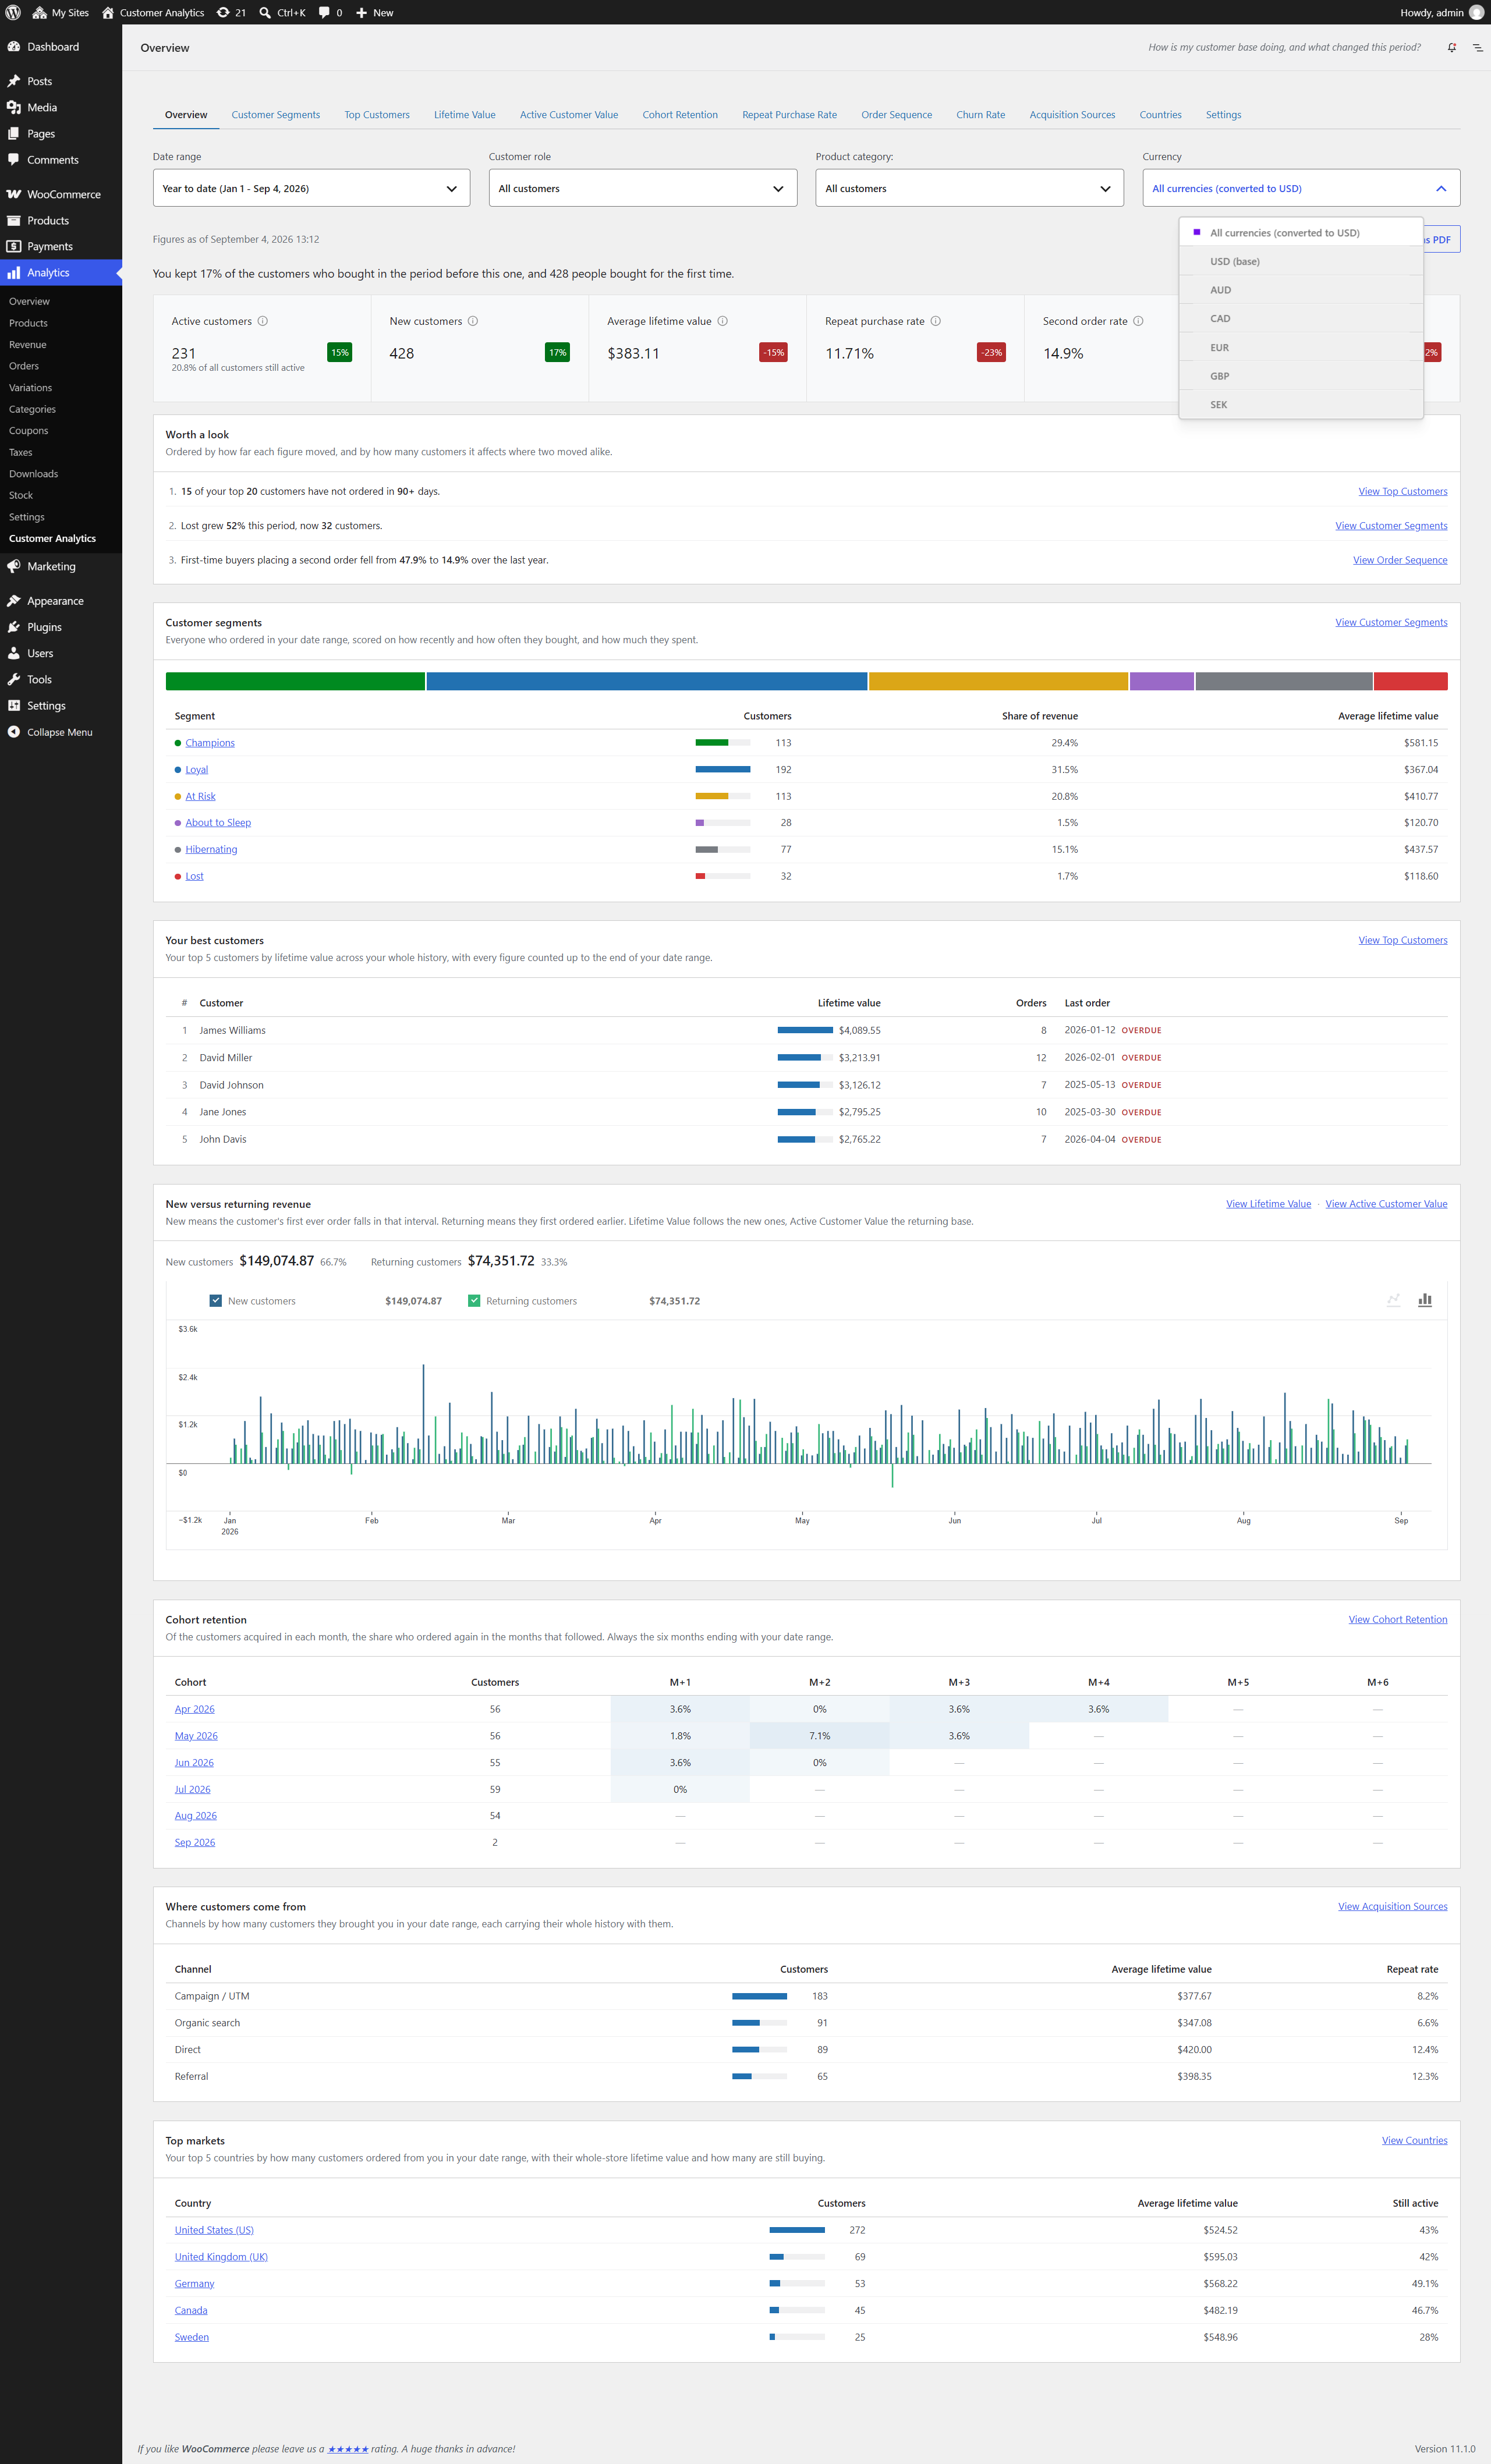
- Six headline figures, each with its change against the previous period of the same length, and each linking to a different report: active customers (with the share of your whole customer list still buying beneath it), new customers, average lifetime value, repeat purchase rate, second order rate, and churn rate. A rising churn rate is shown as a decline, not an improvement
- Worth a look: up to five changes that crossed a threshold this period, most significant first, each with a link to the report that explains it
- Customer segments: everyone who ordered in your date range, by RFM segment, as a single stacked bar, with customers, share of revenue and average lifetime value per segment. Each segment links to the Customer Segments report with that segment already selected
- Your best customers: the five highest lifetime values in your store, numbered by their standing in the Top Customers leaderboard, with how many orders each has placed and when they last ordered. Anyone whose last order is older than your Churn period is marked overdue, which is a store-wide threshold rather than the per-customer buying rhythm behind the Overdue column in Top Customers. The only section that names individuals rather than groups
- New versus returning revenue: how much of each period’s revenue came from first-time buyers, and how much from customers you already had, with the totals and each side’s share of the period above the chart. A customer counts as new in the interval their first ever order falls in, and returning in every interval after that, so the two add up to your revenue rather than double counting anyone. The first order is looked for across your whole history and not only inside the selected date range, so a customer who first bought years ago is returning here even when the range starts this month. It is the one section no single report reproduces, so it links to two: Lifetime Value for the new half, Active Customer Value for the returning half
- Cohort retention: the six most recent monthly acquisition cohorts and the share of each that ordered again in the months after, shaded like the full Cohort Retention heatmap. Each row links to that cohort’s month
- Where customers come from: your top acquisition channels by how many customers they brought you in your date range, with those customers’ average lifetime value and repeat rate
- Top markets: your top countries by how many customers ordered from you in your date range, with those customers’ average lifetime value and still-active share
How values are measured
Most figures follow the date picker and are compared against the period of equal length immediately before it. Some do not, and every section says which customers it is counting in the line under its heading. Three cover a window of their own:
- Second order rate covers the twelve months of acquisitions ending at your range end, compared against the twelve months before that. A first-time buyer only counts in this figure once their first order is old enough that not having returned means something, and on a one-month range almost nobody has reached that point, so a range-scoped figure would be blank nearly every time. The tile states the twelve-month basis when you hover its label
- Cohort retention always shows the six months ending at your range end, because a one-month range contains a single cohort and a cohort grid needs several rows before it says anything. Like the full report, it counts months only once they are complete, so the month in progress is left blank rather than shown as a near-zero
- Your best customers ranks your whole trading history, because “your best customers” is not a statement about one month. Every figure in it is counted up to the end of your date range rather than up to today, so moving the range back answers who your best customers were then, and who was overdue then. Its link opens Top Customers on the same basis
- Where customers come from and Top markets split the difference: which customers they count follows your dates, but what those customers are worth does not. A channel row counts the customers it brought you inside the range, a country row counts the customers who ordered from there inside the range, and both then report those customers’ whole-store lifetime value, repeat rate and active share. So the two strips deliberately count different people, and on a short range the customer totals under them will not match
“Still active” beneath the Customers figure is the share of everyone who has ever ordered from you whose last order falls inside your saved Churn period. It is measured against your whole customer list rather than against the customers in the range, because every customer in the range has ordered recently by definition, which would hold that figure close to 100% at all times.
What gets listed under “Worth a look”
- A risk segment (At Risk, About to Sleep, Hibernating, Lost) grew by at least 20% and at least 5 customers
- A valuable segment (Champions, Loyal) shrank by at least 20% and at least 5 customers
- Churn rose, the repeat purchase rate fell, or the second order rate fell, by at least 5 percentage points
- The newest measurable cohort’s first-month retention is at least 5 percentage points below the average of the three cohorts before it
- New customers fell by at least 20% and at least 5 customers
- At least 3 of your top 20 customers by lifetime value have not ordered within your Churn period
Every rule requires at least 50 customers behind it before it can fire. Without that floor, a move of three customers reads as “+67%” and the list fills with noise on exactly the stores least able to judge it. When nothing qualifies, the list says so rather than reaching for something to display. The thresholds can be changed with the customer_analytics_dashboard_attention_thresholds filter.
Printing and PDF
“Print / Save as PDF” prints the dashboard through your browser’s own print dialog, so choosing “Save as PDF” there produces the file instead of paper. There is nothing to install, and nothing leaves your server.
The “Sections” button beside it chooses what goes in. Every section is included until you say otherwise, and switching one off leaves it out of the printout only: it stays on the dashboard, links and all. Your choice is remembered for your own account, so the report you send every month keeps its shape without being set up again.
The printed page is written for someone who has never seen the plugin. It drops the WordPress admin interface, the filters and the links, and leads with your store name, your logo, your store’s web address, the date range, the time the figures were taken and the currency they are in. The logo is taken from the header image set for WooCommerce emails, or from your theme’s site logo if that is not set. One small line at the foot names the plugin that produced it. Each page carries its number, so your browser’s own “Headers and footers” option can stay switched off and its long admin web address stays off the page.
The new versus returning chart is replaced by a table of the same figures when printing, because a chart sized for a wide screen is not legible at page width, and daily periods are grouped into months so that table stays short. The cohort grid prints its percentages as text as well as color, so it still reads if your browser is set not to print background graphics.
Important notes
- The dashboard is cached, and the page states when its figures were taken. “Refresh” rebuilds them; it is limited to once a minute for the whole site, since the result is shared by everyone viewing it
- On stores above roughly 50,000 orders the dashboard is built in the background instead of while you wait. Sections appear as they finish, so the page fills in over your first visits rather than all at once. Smaller stores build it immediately and never see this
- Stores with fewer than 50 customers in total see a short explanation that these patterns need a few months of trading before they appear, along with the reports that already work at that volume, rather than a screen of empty charts
- When most of the cohorts shown hold fewer than 20 customers, a notice says so, because month-to-month movement on small cohorts looks larger than it is
- When the period immediately before your date range holds fewer than 20 customers, the plain sentence at the top leaves the retention share out and reports first-time buyers alone, because a share measured over a handful of people moves too far on a single customer to be worth stating
- The dashboard has no CSV export of its own. Each section links to the report behind it, and those export in full
- There is no comparison picker here: the comparison is always the period of equal length immediately before the one you selected
Filters
- Date range selection
- Customer role: segment the dashboard by WordPress user role, or select Guests for orders placed without an account
- Product category: narrow the dashboard to the customers who bought from one or more product categories, matching those who ever purchased from them, only ever purchased from them, or first purchased from them, and requiring any or all of the selected categories; this selects which customers are reported, not which sales are counted
- Currency: on stores that have taken orders in more than one currency, report on a single currency, or on all of them converted to your store currency at the rates set in the settings
Data Export: Print or save as PDF; CSV export is available in each of the reports the dashboard links to
1. Customer Segments (RFM)
↑ Back to topWho are my best customers, and who is slipping away?
Location: WooCommerce → Analytics → Customer Analytics → Customer Segments tab
Group customers into actionable segments based on Recency, Frequency, and Monetary value (RFM), then act on them directly, including one-click coupon creation for a chosen segment or for individual customers you pick out of the table.
How scoring works
Every customer is scored from 1 to 5 on three dimensions:
- Recency: How recently they last ordered, measured from the end of the selected date range (more recent = higher score)
- Frequency: How many orders they placed (more orders = higher score)
- Monetary: How much they spent in total (higher spend = higher score)
By default, scores use quintiles: the customer base is split into five equal groups for each dimension. You can switch to fixed thresholds in Settings instead. Stores with fewer than 50 qualifying customers automatically use fixed thresholds (quintiles are not meaningful for very small datasets), and an on-screen notice indicates when this fallback is active.
The six segments
Each customer’s R, F, and M scores map to one of six named segments:
- Champions: Recent buyers who order often and spend the most, so these are your best customers
- Loyal: Consistent, repeat buyers with solid spend
- At Risk: Previously valuable customers who haven’t ordered in a while
- About to Sleep: Below-average recency and frequency, so they are slipping away
- Hibernating: Long time since last order, low frequency and spend
- Lost: Lowest recency, frequency, and monetary scores
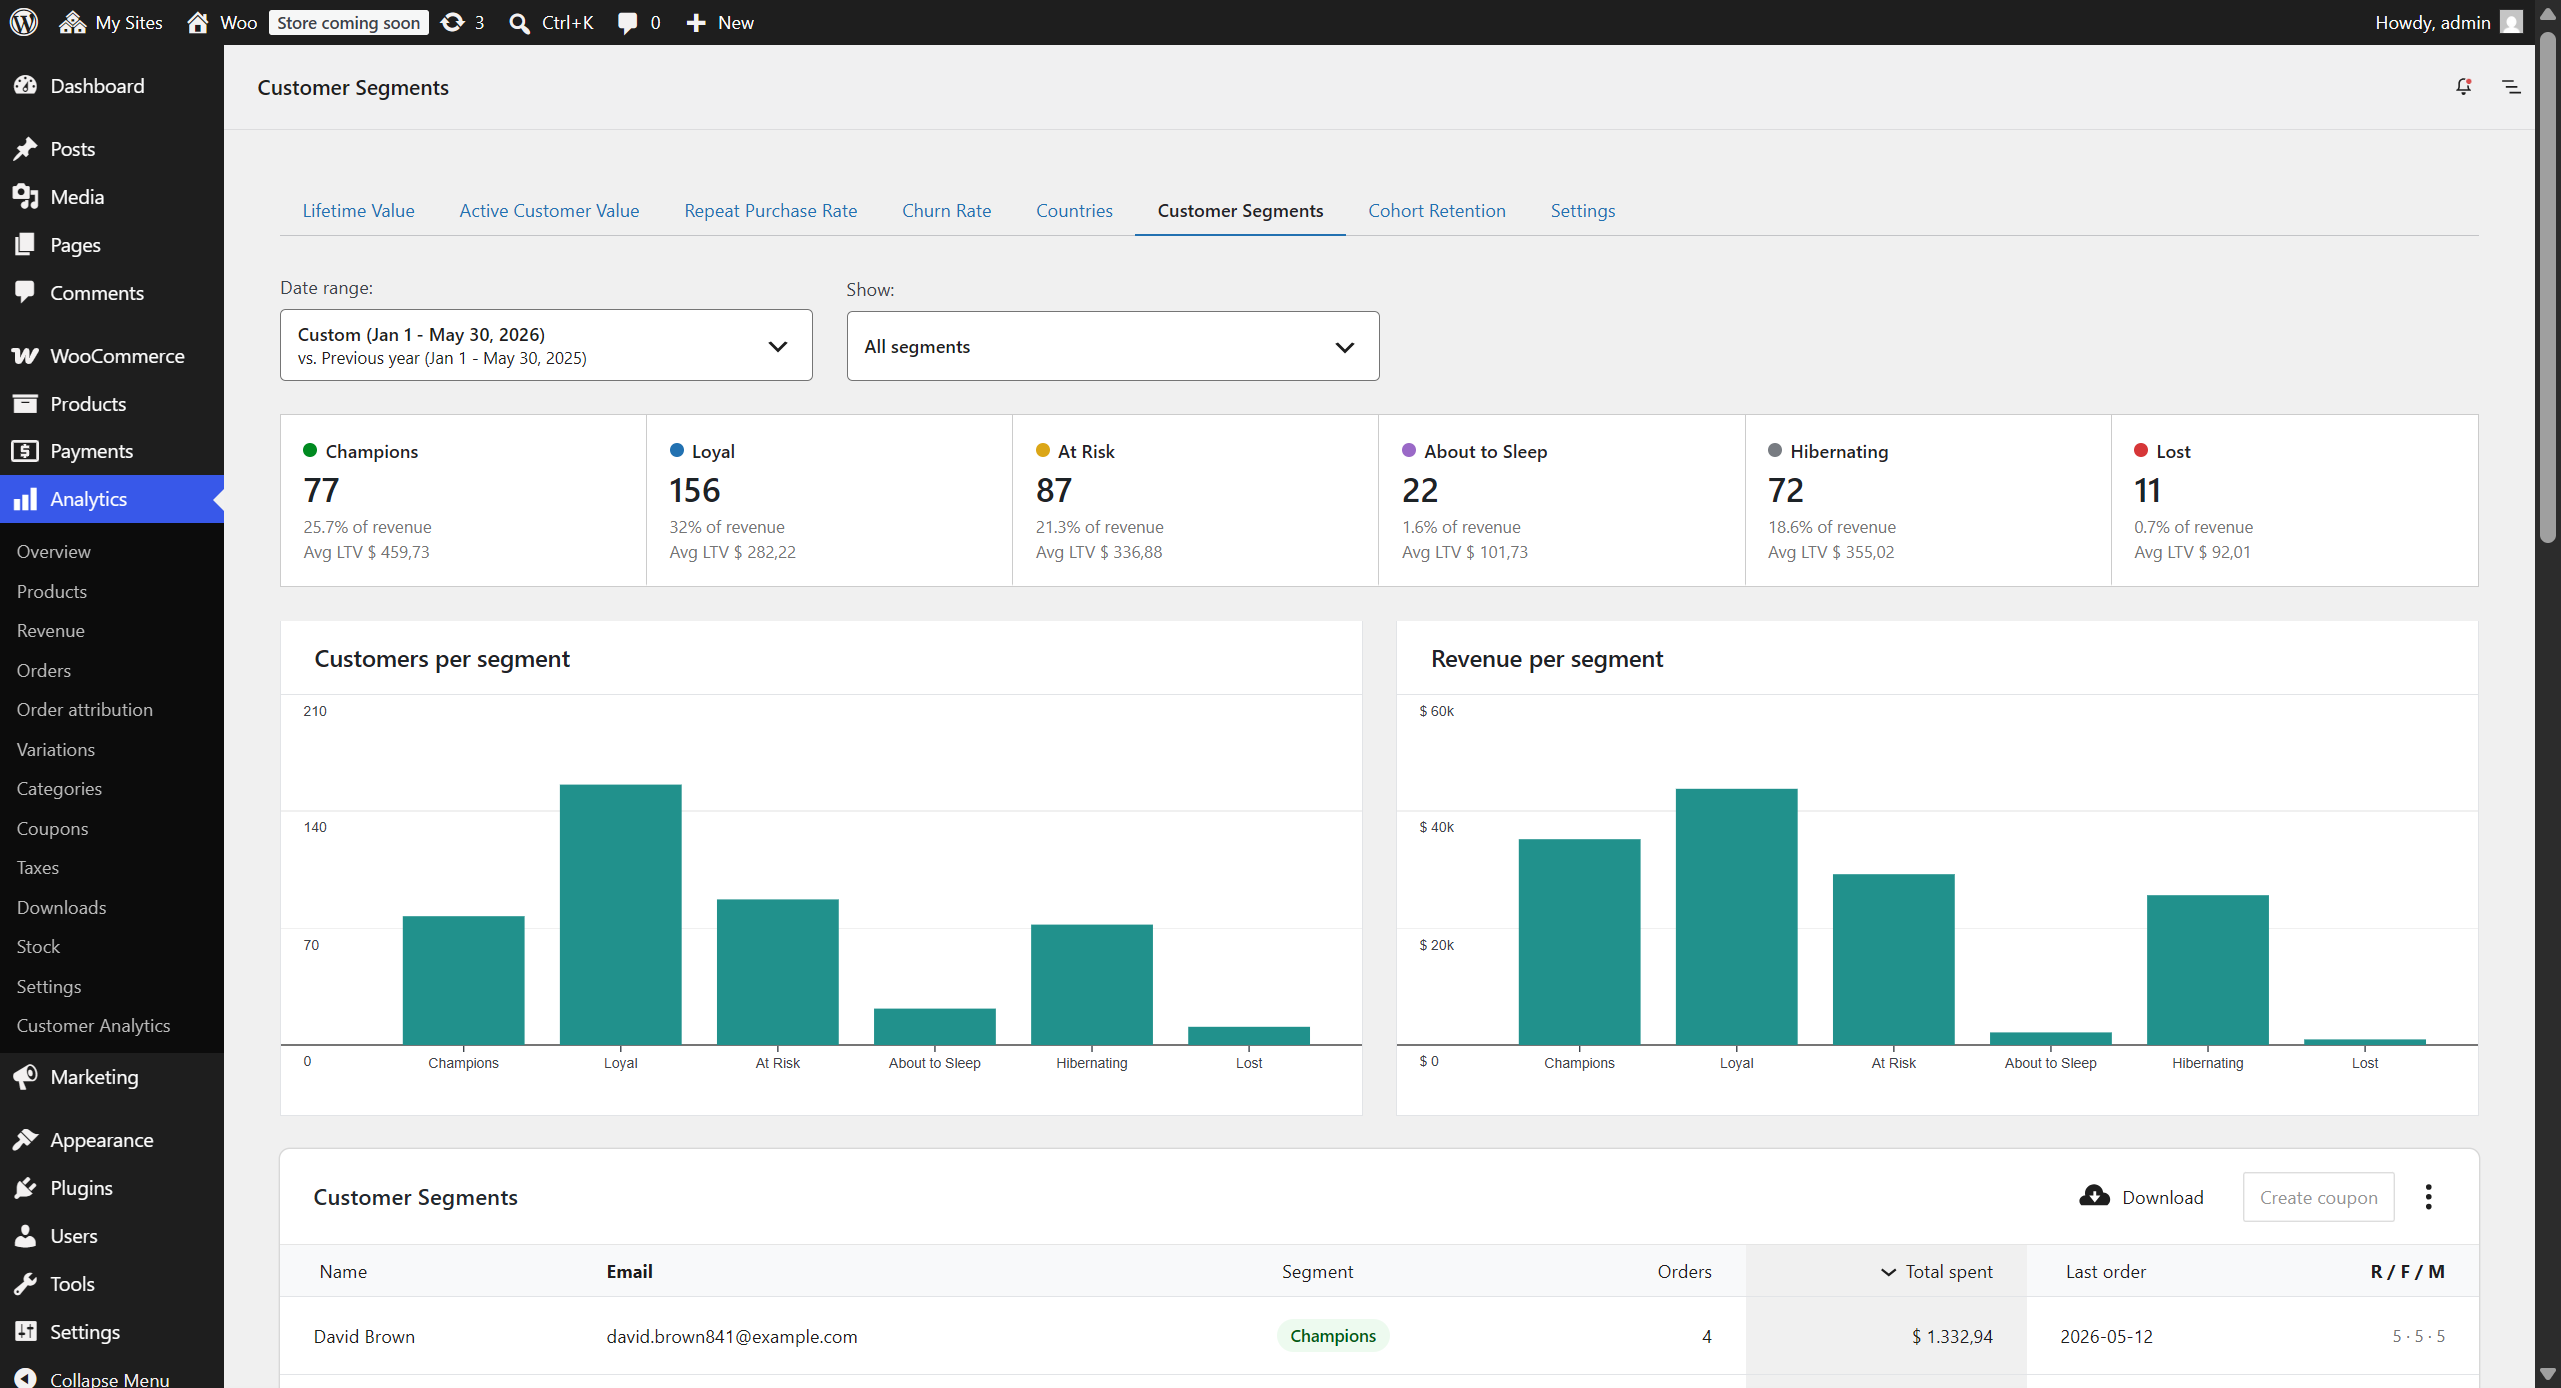
Segment cards & metrics
A row of cards summarizes each segment with:
- Customer count: Number of customers in the segment
- % of revenue: Share of total revenue contributed by the segment
- Average lifetime value: Average total spent per customer in the segment (within the selected date range)
Click any card to filter the customer table to that segment; click it again to clear the filter.
Charts
- Customers per segment: Bar chart of customer counts across segments
- Revenue per segment: Bar chart of revenue across segments
RFM is a snapshot of your customer base for the selected period, so these charts compare segments side-by-side rather than showing a time series.
Customer table
A sortable table lists individual customers with: Name, Email, Segment, Orders, Lifetime value, Last order, Avg order gap (days), Predicted next order, Overdue, and their R / F / M scores. Use the column menu to show or hide columns, the Download button to export, and the row checkboxes to select customers to email. Click a customer’s name to open their profile, described under Customer profile in the usage guide.
The cadence columns reflect each customer’s own buying rhythm: the average order gap is the time from their first to their last order divided by the number of gaps between orders, the predicted next order is one average gap after their last order, and Overdue shows how far past that prediction they are as a percentage of their own gap (customers not yet due show “Due in N days”). Sort the At Risk segment by Overdue to find the customers furthest past their usual buying pattern, which makes them the most precise win-back targets.
Create a coupon
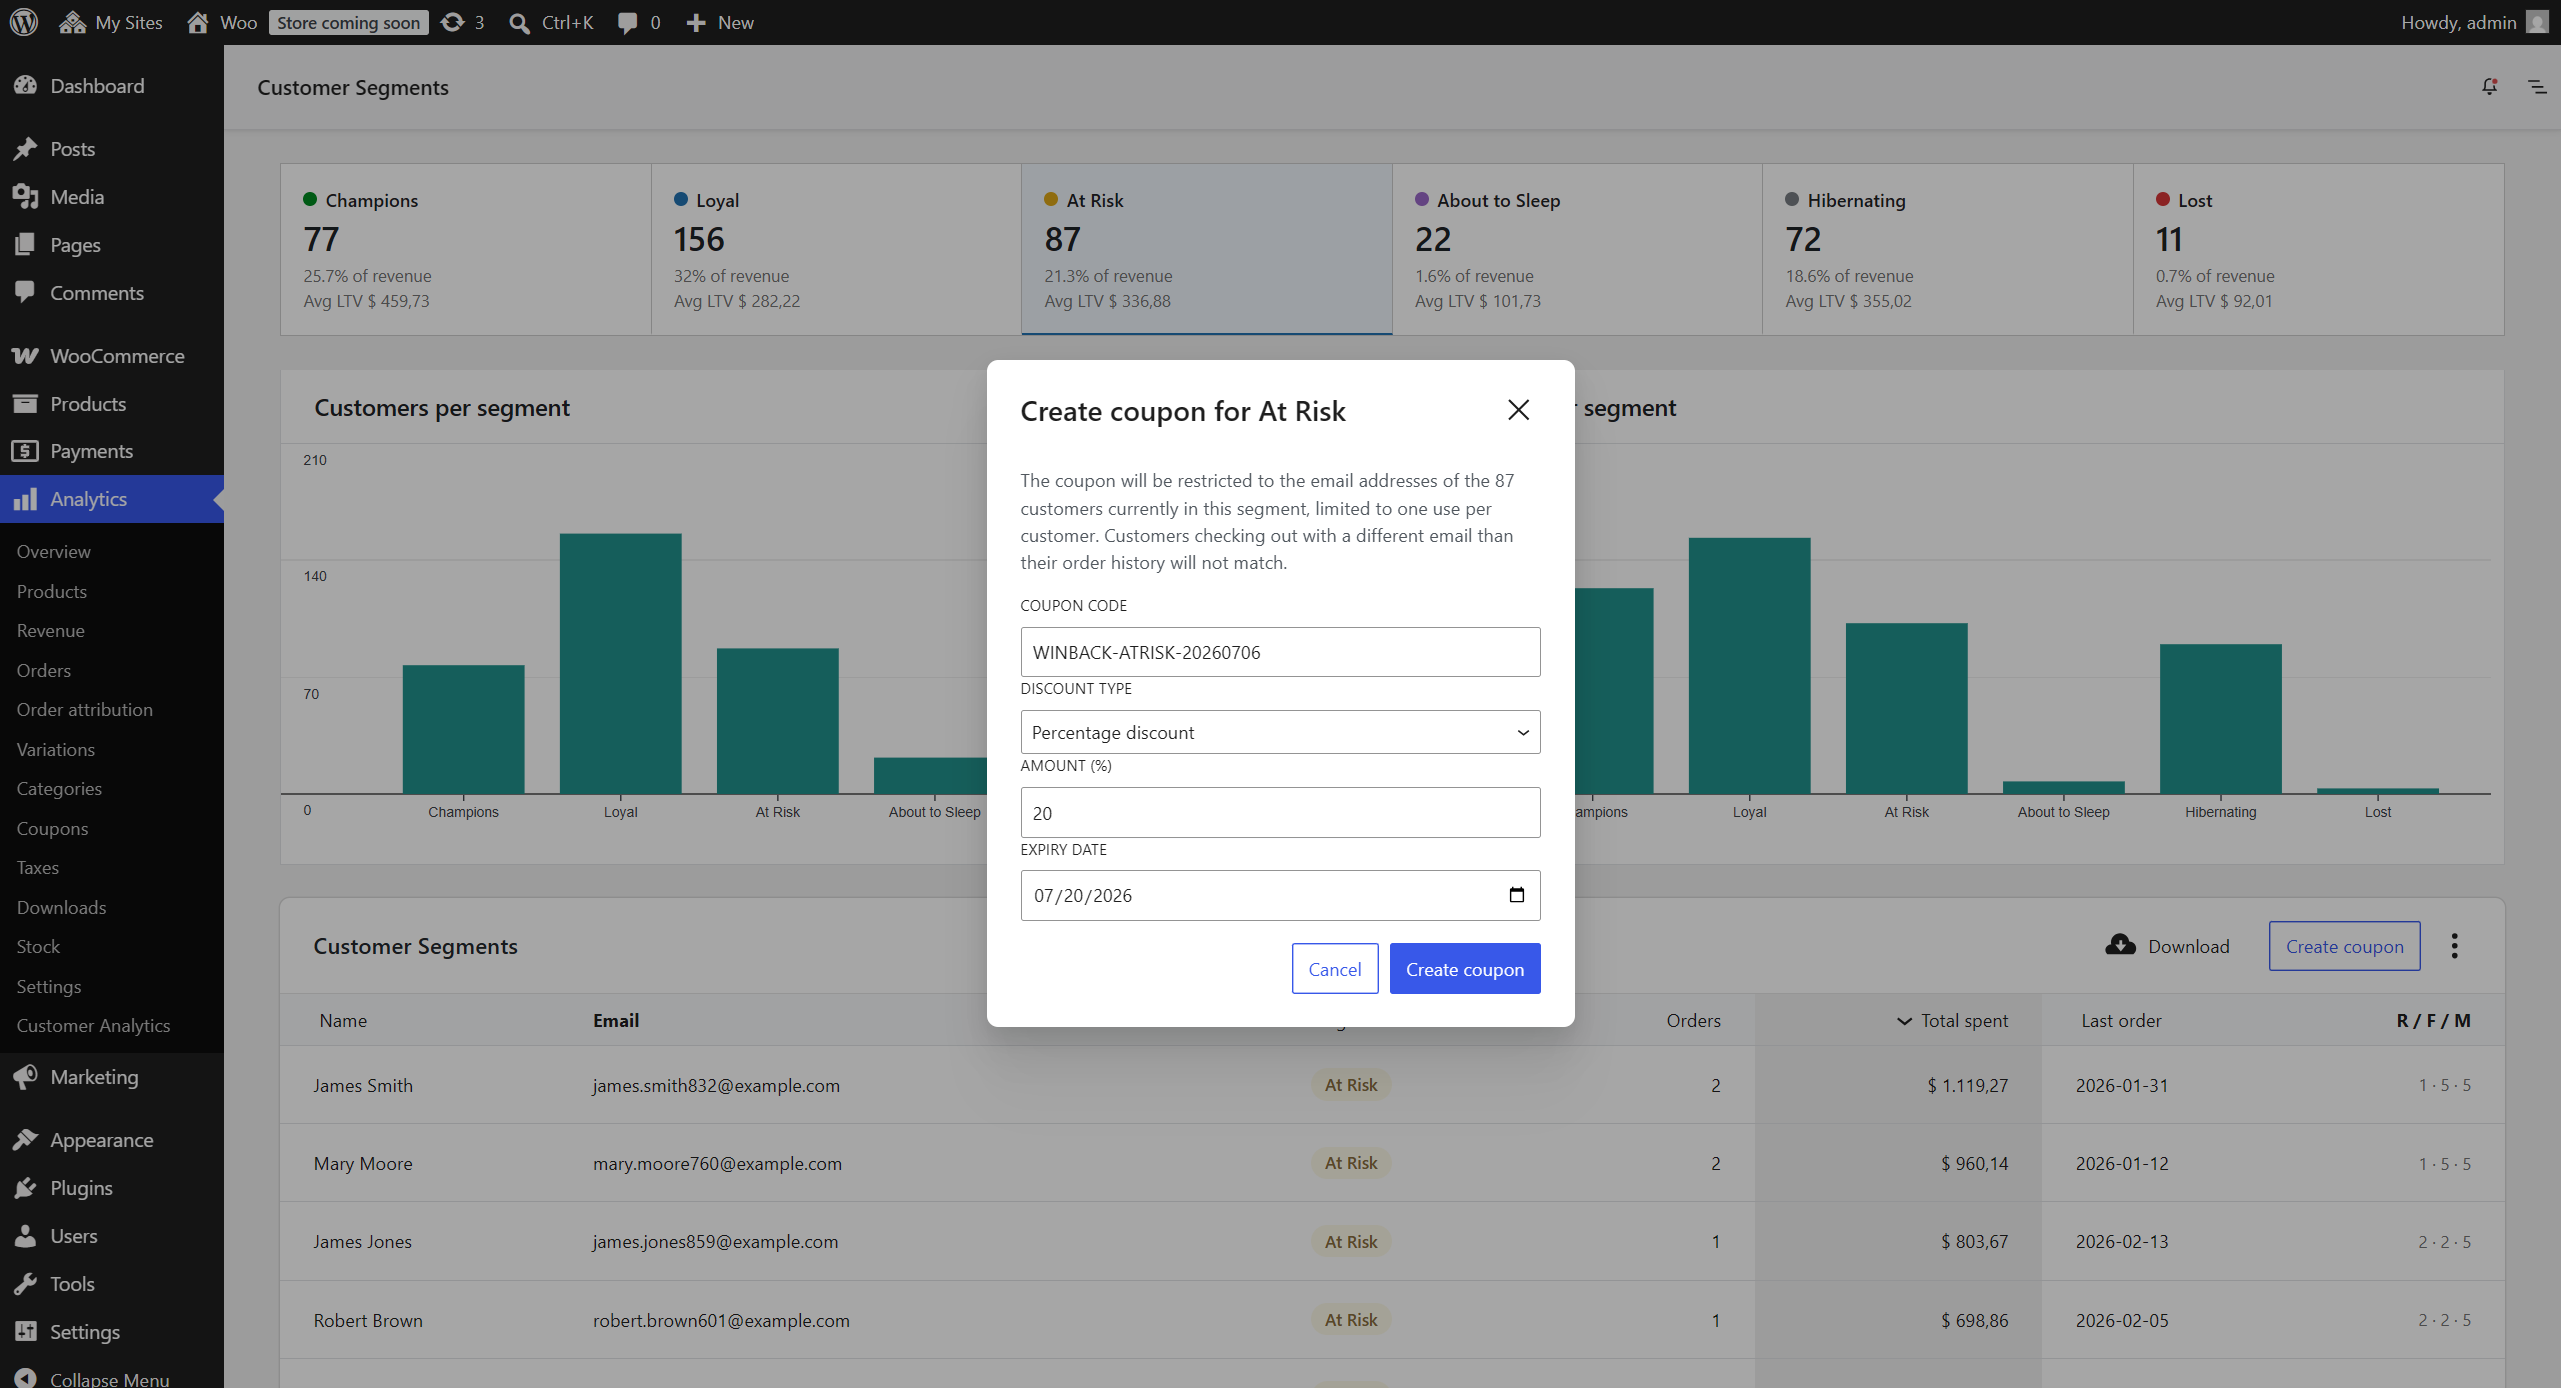
The Create coupon button generates a WooCommerce coupon restricted to a group of your customers’ email addresses, which is ideal for win-back or loyalty campaigns. Who gets the coupon decides which group: everyone in the selected segment, or only the customers you ticked in the table. The choice appears once you have both, and it starts on the selection, because ticking rows is the more specific instruction. You can set:
- Discount type: Percentage (default) or fixed cart discount
- Amount: The discount value
- Expiry date: Defaults to 14 days from today
- Coupon code: A suggested code is provided (e.g.
WINBACK-ATRISK-20260612) and can be edited
The coupon is limited to one use per customer, and the email list is built on the server from the current segment rather than taken from your browser, so the coupon can only ever reach customers the report actually holds. After creation, a link takes you straight to the coupon editor.
Picking customers is what makes a coupon match a campaign. Sort the At Risk segment by Overdue, tick the dozen customers furthest past their usual buying rhythm, and the offer you send them is valid for those twelve alone instead of for every customer in the segment. The header checkbox selects the current page, and a selection carries across pages and re-sorts, so you can gather customers from several pages first.
Email selected customers
Tick the checkbox on any customer row and the Email selected button opens a dialog holding those customers’ email addresses. From there, Open in email client starts a new message with every address in the BCC field, so the recipients cannot see each other, and Copy addresses puts the list on your clipboard for a mailing tool that expects to be pasted into. It is the quick way to reach a handful of customers without exporting a CSV first.
The header checkbox selects every customer on the current page, and a selection carries across pages and re-sorts, so you can gather customers from several pages before sending. Changing the date range or any filter clears the selection, because it changes which customers the report covers. Handing more than 200 addresses to an email client through a link is unreliable, so above that the dialog offers only Copy addresses, and above 50 it warns that some email clients silently drop the addresses that do not fit. If Open in email client appears to do nothing, your computer has no email program set to handle links of this kind, which is normal if you read your mail in a browser tab. Use Copy addresses instead.
Important notes
- Segments are computed for the selected date range, with recency measured from the end of that range. This is a period-based view, not an all-time/lifetime RFM
- Average lifetime value on the cards is the average total spent per customer within the selected range
- Order status follows your WooCommerce Analytics settings. The Monetary value subtracts refunds (matching WooCommerce), while Frequency and Recency count real orders only; calculations use order creation date
- Average order gap, predicted next order, and Overdue require at least two real orders (and an average gap of at least one day); customers without a usable cadence show a dash
- Customers are grouped by billing email address
Filters
- Date range selection
- “Show” dropdown to filter by a single segment (mirrors the clickable cards)
- Customer role: segment the report by WordPress user role, or select Guests for orders placed without an account
- Product category: narrow the report to the customers who bought from one or more product categories, matching those who ever purchased from them, only ever purchased from them, or first purchased from them, and requiring any or all of the selected categories; this selects which customers are reported, not which sales are counted
- Currency: on stores that have taken orders in more than one currency, report on a single currency, or on all of them converted to your store currency at the rates set in the settings; a single currency covers that currency’s orders alone, so counts and dates follow them too
Data Export: CSV download includes every customer in the current view with their email address and segment.
2. Top Customers
↑ Back to topWhich of my customers are worth the most, and which are overdue for their next order?
Location: WooCommerce → Analytics → Customer Analytics → Top Customers tab
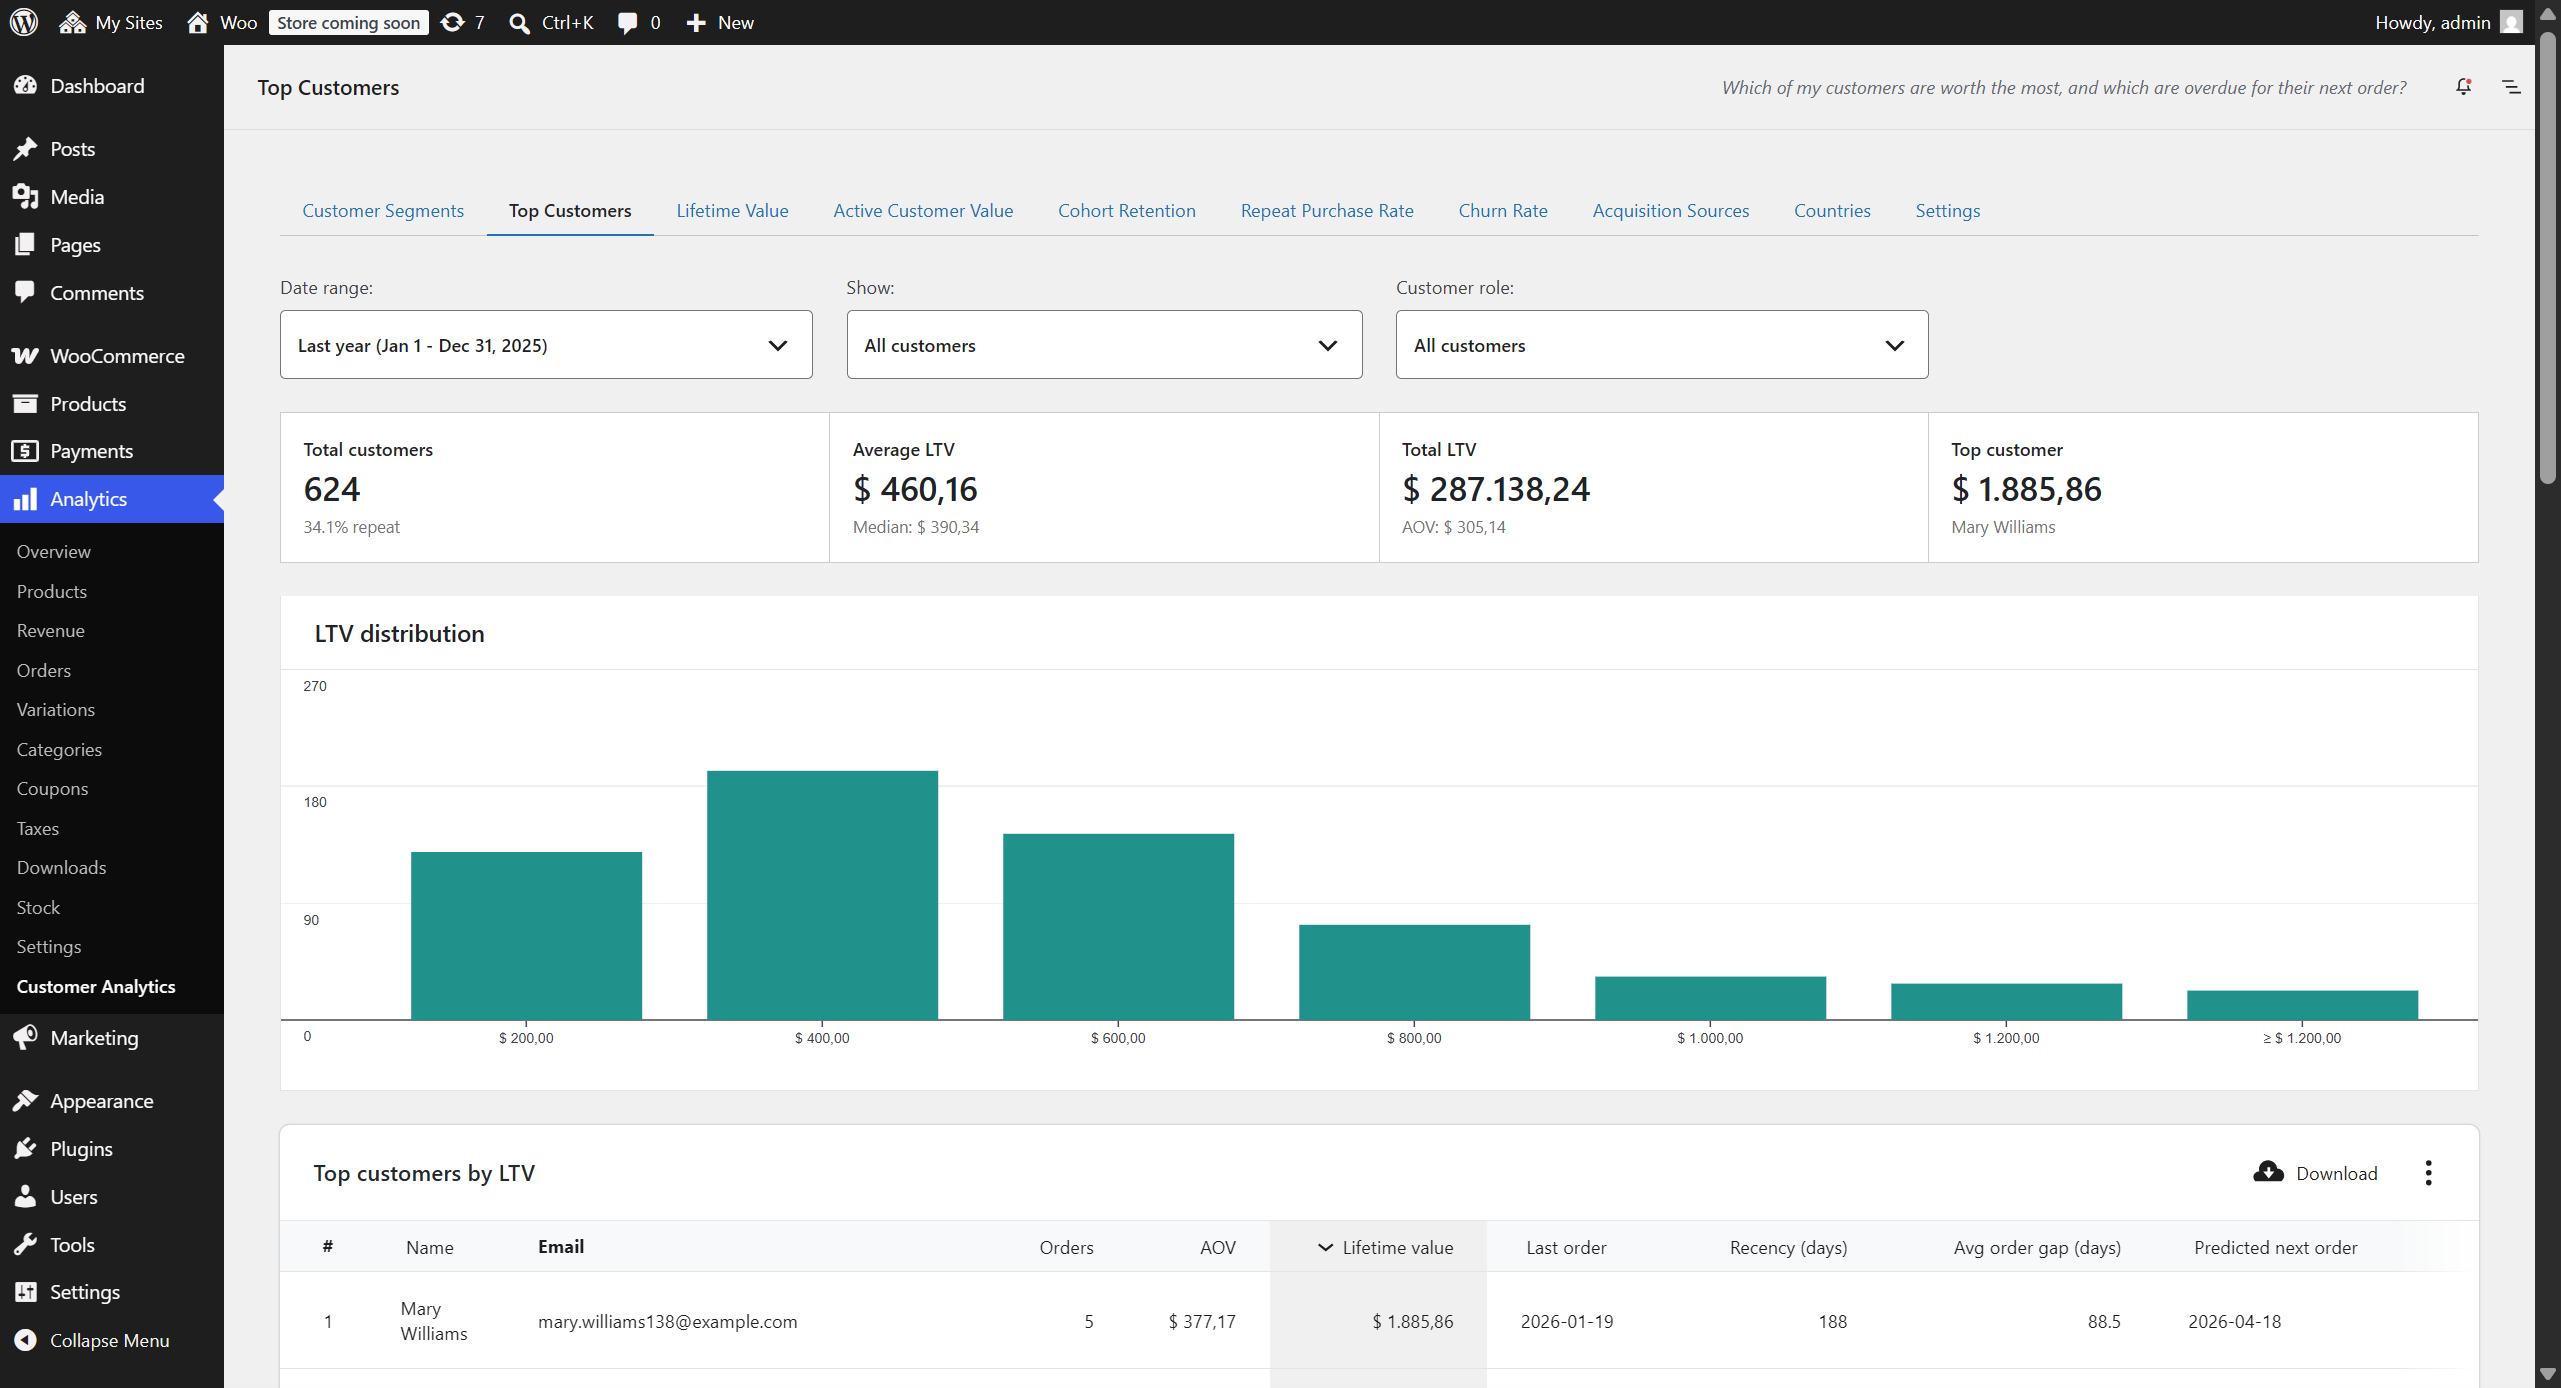
See who your most valuable customers are, as of today or any date in the past. The report ranks customers by lifetime value in a leaderboard, shows how lifetime spend is distributed across your customer base, and predicts each customer’s next order from their own buying rhythm.
What is displayed
- Summary cards: Customers acquired (with the share who are repeat buyers), Average lifetime value (with the median), Total lifetime value (with average order value), and your single top customer
- Lifetime value distribution histogram: How many customers fall into each lifetime-spend bracket. Brackets use equal, rounded widths sized to where the bulk of your customers sit, with an open-ended top bracket (“≥ …”) that catches outliers, so one very large customer doesn’t flatten the rest of the chart
- Top customers leaderboard: A sortable table with rank (#), Name, Email, Orders, AOV, Lifetime value, Last order, Recency (days), Avg order gap (days), Predicted next order, and Overdue, sorted by lifetime value by default. Each row carries a checkbox for selecting customers to email or to build a coupon for. Click a name to open that customer’s profile, described under Customer profile in the usage guide
How values are measured
The selected date range chooses which customers appear: those whose first order falls in the range (the same acquisition window as the Lifetime Value report). The values themselves are lifetime figures, covering every order the customer has placed up to the “Values as of” date, which defaults to today. Pin “Values as of” to a past date and the whole report shows what it would have looked like then: who your top customers were, and their spend, recency, and predictions as of that date. A wide date range with the default “Values as of” answers the simplest question of all: who are my top customers, ever.
Predicted next order & Overdue
Each customer’s average order gap is the time from their first to their last order divided by the number of gaps between orders. The predicted next order is one average gap after their last order, and Overdue shows how far past that prediction they are as a percentage of their own gap (a customer not yet due shows “Due in N days”). The prediction requires at least two orders and an average gap of at least one day; customers without a usable cadence show a dash.
Create a coupon
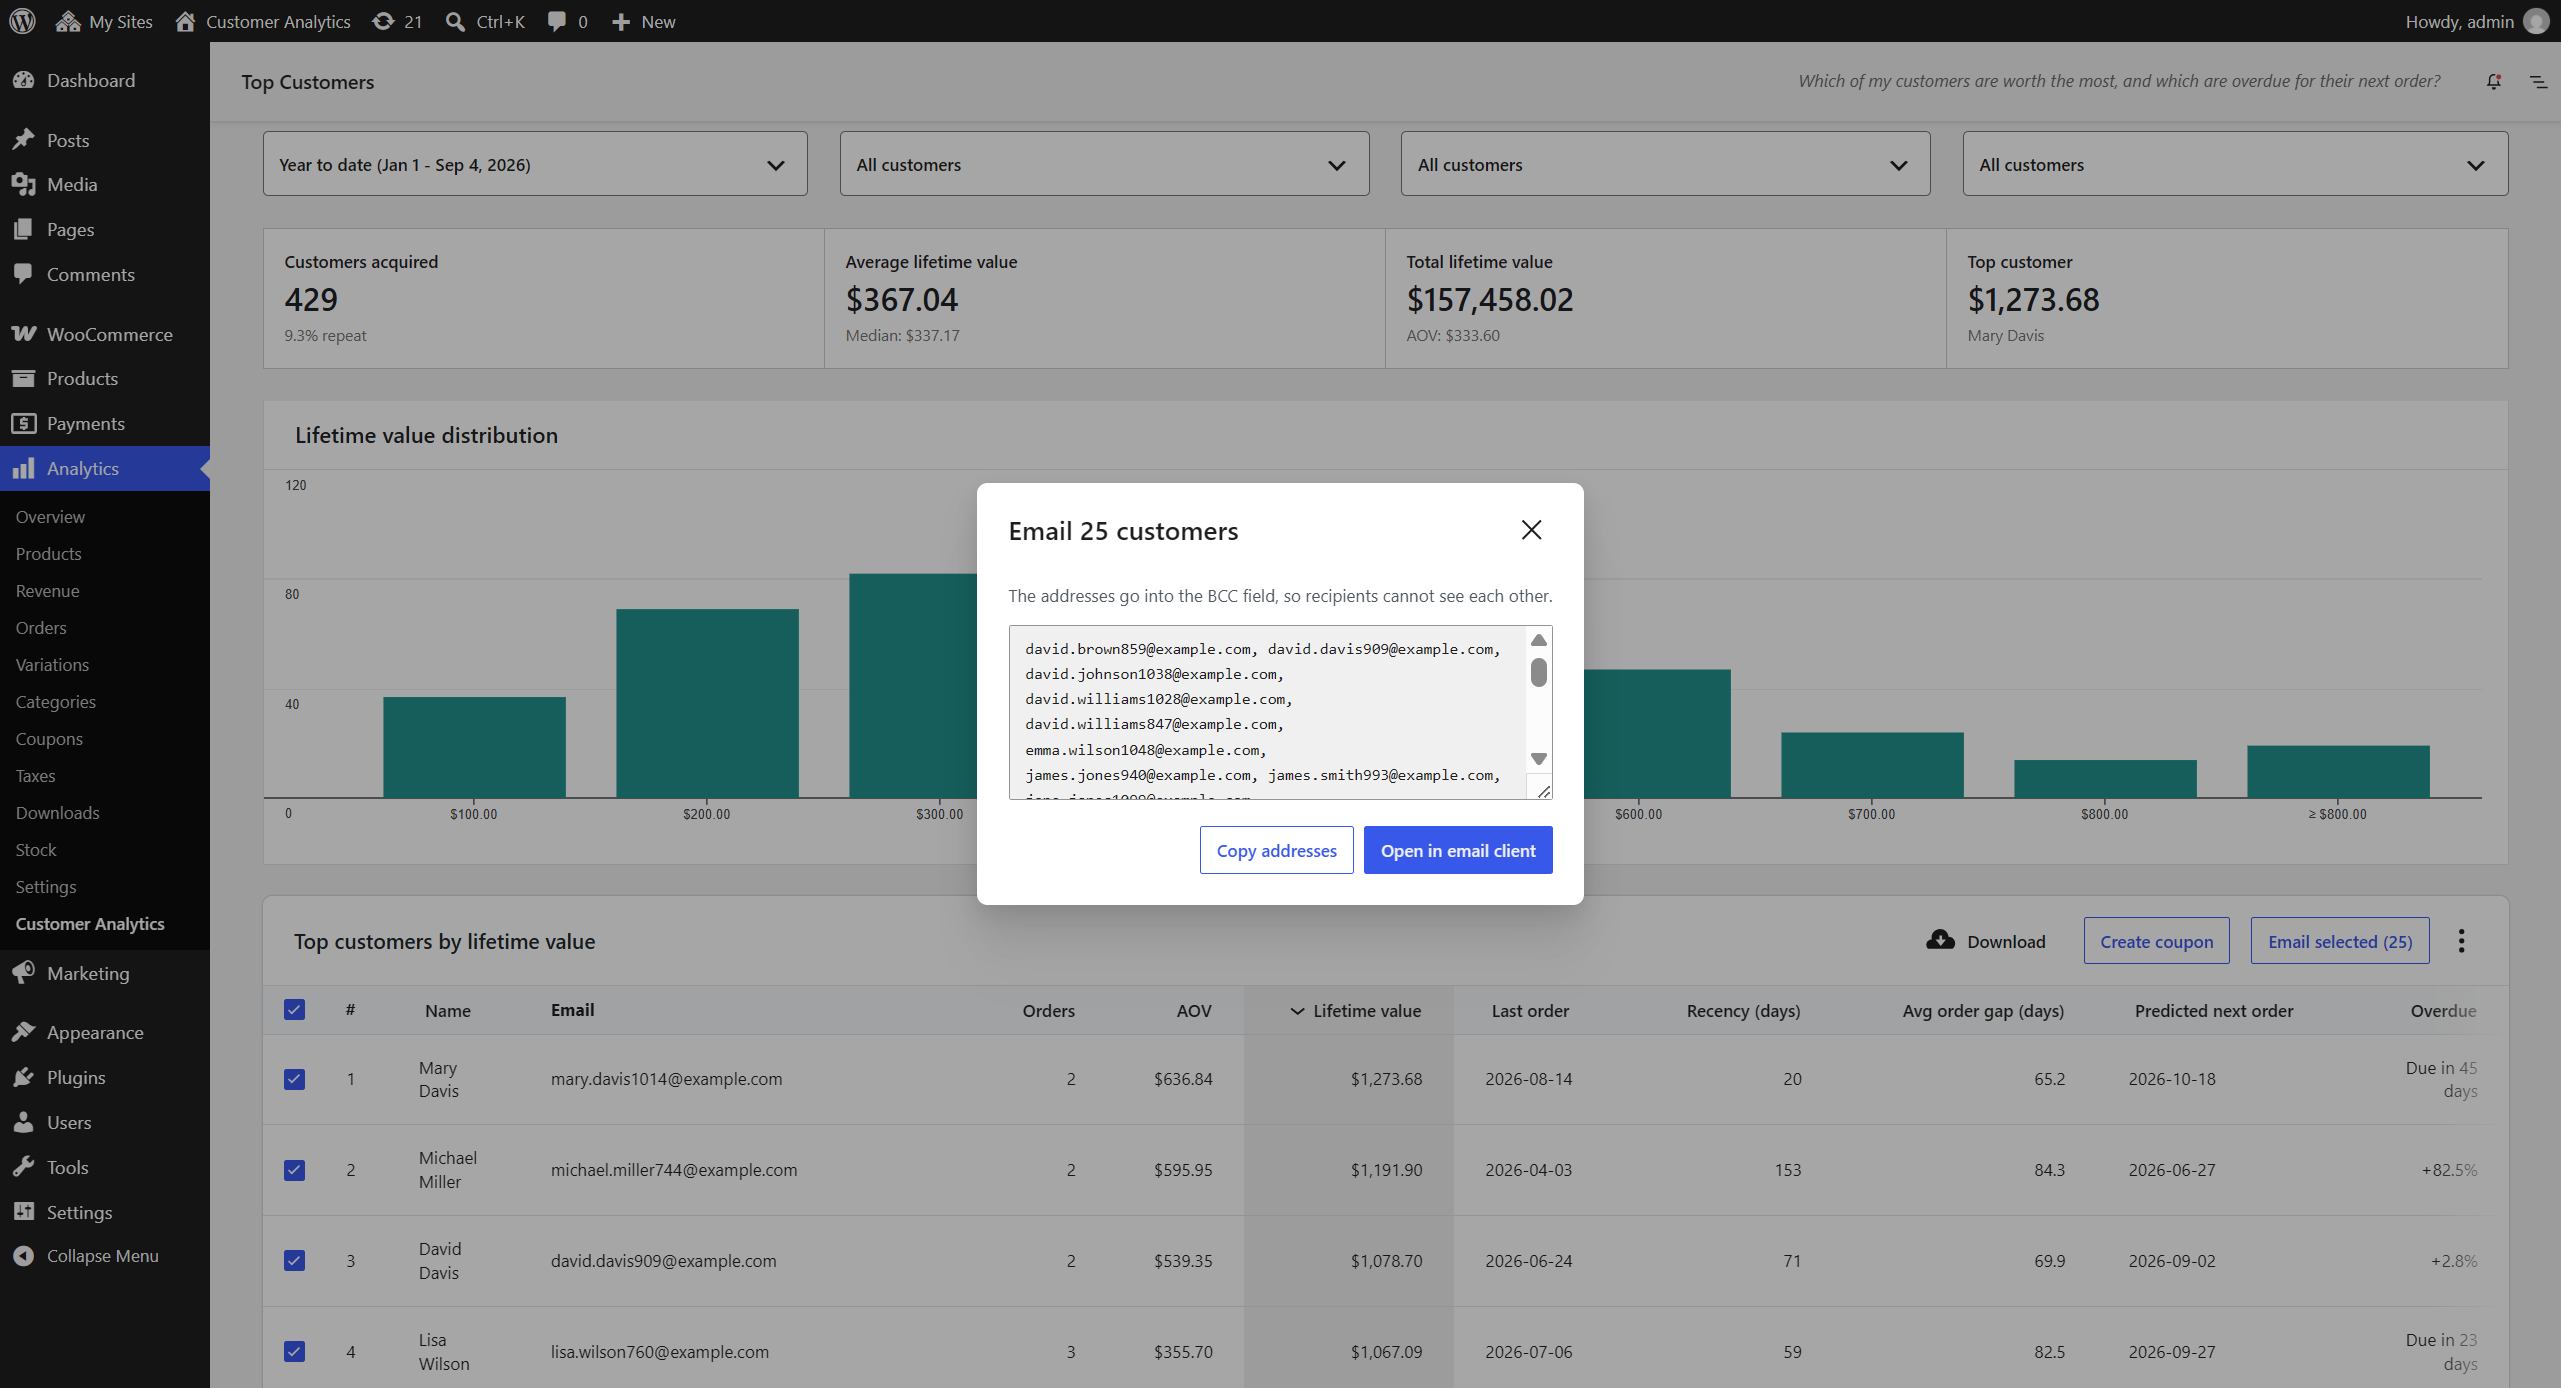
Tick the customers you want and the Create coupon button issues a WooCommerce coupon restricted to their email addresses, limited to one use each. Here the coupon is always for the customers you ticked, with no report-wide alternative, because this report covers every customer acquired in the date range and that is a list, not an audience. You set the discount type, amount, expiry date and code in the same dialog the Customer Segments report uses, and a link then takes you straight to the coupon editor.
This is the report that gives each customer a number, so it is the place to reward your best customers as such. Leave the leaderboard on its default sort, tick the top 25, and the offer reaches exactly the 25 customers who have spent the most with you. The email list is built on the server from the report itself, so a customer who is no longer in it is left off and the confirmation tells you how many were included.
Email selected customers
Tick the checkbox on any customer row and the Email selected button opens a dialog holding those customers’ email addresses. From there, Open in email client starts a new message with every address in the BCC field, so the recipients cannot see each other, and Copy addresses puts the list on your clipboard for a mailing tool that expects to be pasted into. It is the quick way to reach a handful of customers without exporting a CSV first.
The header checkbox selects every customer on the current page, and a selection carries across pages and re-sorts, so you can gather customers from several pages before sending. Changing the date range or any filter clears the selection, because it changes which customers the report covers. Handing more than 200 addresses to an email client through a link is unreliable, so above that the dialog offers only Copy addresses, and above 50 it warns that some email clients silently drop the addresses that do not fit. If Open in email client appears to do nothing, your computer has no email program set to handle links of this kind, which is normal if you read your mail in a browser tab. Use Copy addresses instead.
Important notes
- Refunds are subtracted from lifetime value (a fully refunded order nets to zero), matching WooCommerce
- Guest orders are grouped by billing email address; calculations use order creation date
- The rank column (#) is the customer’s standing by lifetime value, so it stays with them when you sort the table by another column or move to another page. It is a rank within what the report currently covers: the date range, the “Values as of” date and any filters you have applied
Filters
- Date range selection (picks the acquisition window, which decides who appears)
- “Values as of” snapshot date: choose Show → Advanced filters, add the “Values as of” filter, pick a date, and click Filter
- Customer role: segment the report by WordPress user role, or select Guests for orders placed without an account
- Product category: narrow the report to the customers who bought from one or more product categories, matching those who ever purchased from them, only ever purchased from them, or first purchased from them, and requiring any or all of the selected categories; this selects which customers are reported, not which sales are counted
- Currency: on stores that have taken orders in more than one currency, report on a single currency, or on all of them converted to your store currency at the rates set in the settings; a single currency covers that currency’s orders alone, so counts and dates follow them too
Data Export: CSV download of the full leaderboard, including email addresses and the cadence columns
3. Lifetime Value (Customer Lifetime Value / CLV)
↑ Back to topWhat is an average customer worth over their lifetime?
Location: WooCommerce → Analytics → Customer Analytics → Lifetime Value tab
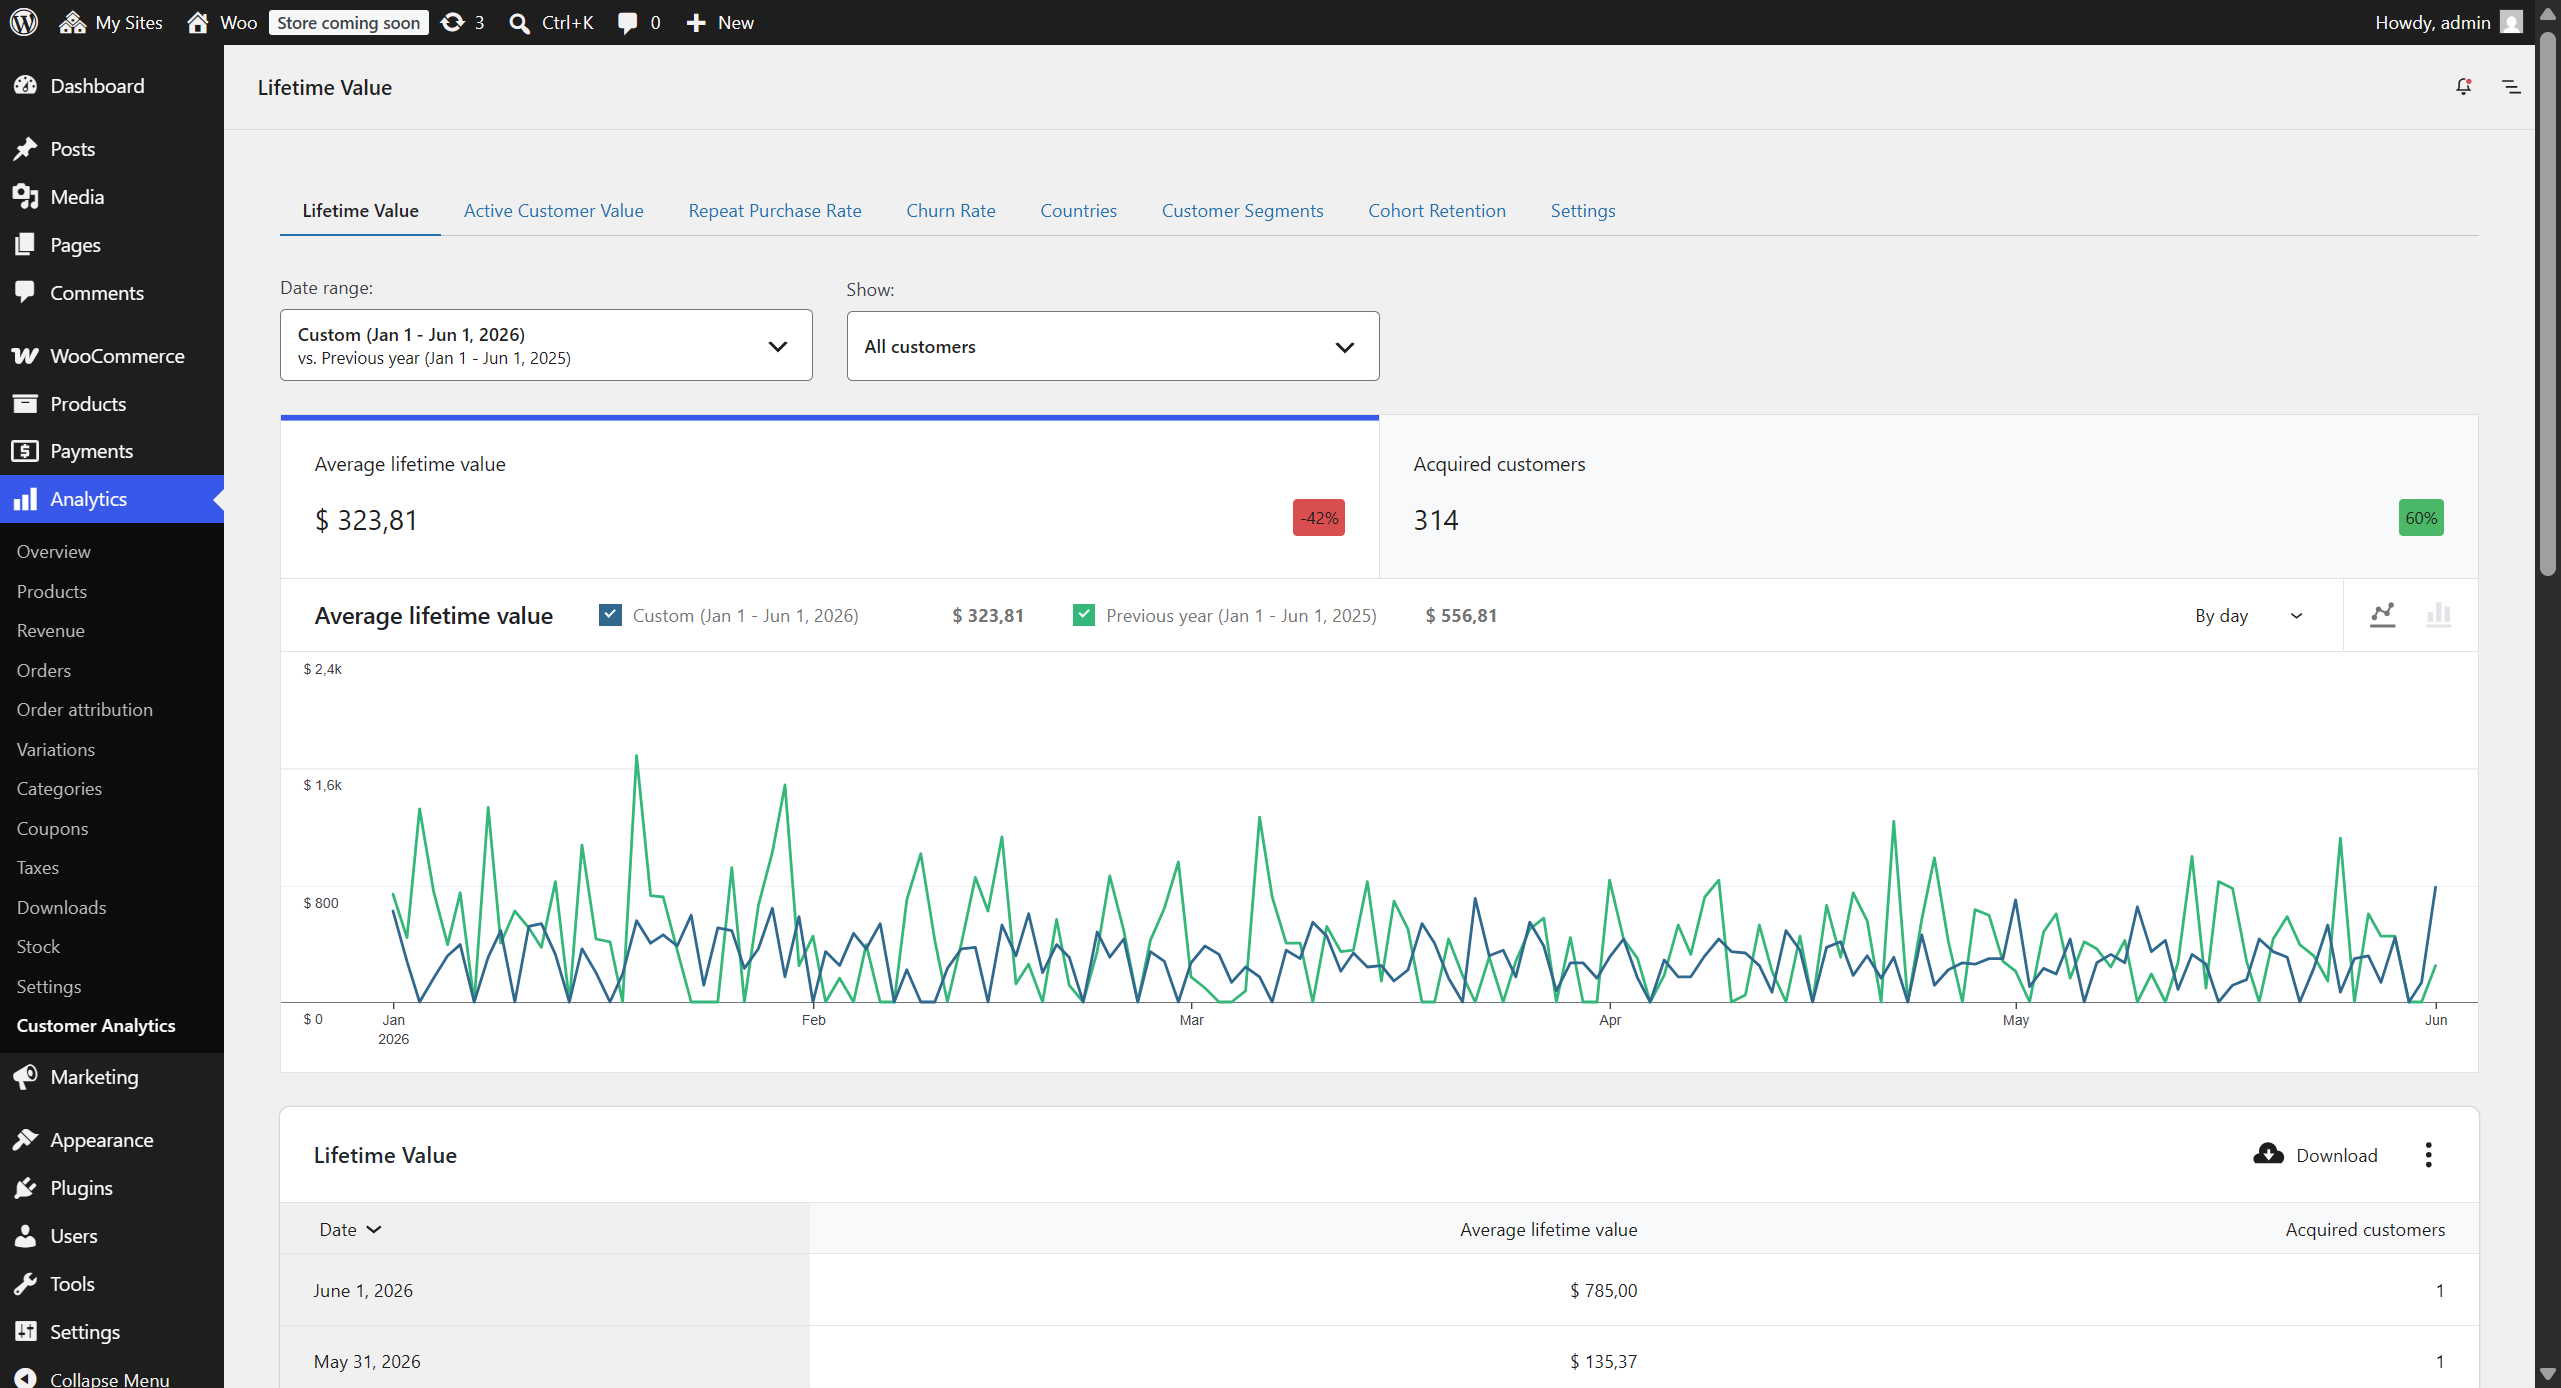
Track the average revenue generated by customers over their entire relationship with your store.
Metrics displayed
- Average lifetime value: Mean revenue per customer, in your store’s currency or in whichever currency the report is set to
- Acquired customers: Number of customers acquired in each period (those whose first order falls in that interval), and the denominator behind the average lifetime value
- Average customer tenure (months): Time since each customer’s first order (measured to today), averaged across the segment, and defined for every customer, including one-time buyers (shown in the summary; per-period it would only restate the acquisition date, so it is not charted)
- Expected customer lifespan (months): Textbook expected lifespan = 1 ÷ monthly churn rate, using the saved Churn period as the inactivity threshold (shown in the summary)
- Expected lifetime value: Textbook expected CLV = average monthly value per customer (lifetime value spread over the customer’s active tenure) × expected lifespan (shown in the summary)
Important notes
- Calculations are based on order creation date (not completion or payment date)
- Refunds are subtracted from each customer’s lifetime value (a fully refunded order nets to zero), matching WooCommerce
- Guest orders are grouped by billing email address
Also, keep in mind that date shown is the customer’s first order date (acquisition date). All subsequent orders by that customer, regardless of when they occurred, are rolled up into that first-order date’s row.
So if a customer’s first order was Jan 5 and they placed another order Jan 20, both orders appear only under Jan 5. The Jan 20 date shows nothing for this customer because they weren’t “acquired” on Jan 20.
Customer segmentation
Selectable from dropdown with percentage of each segment displayed:
- All customers: Complete customer base analysis
- One-time buyers: Customers with exactly 1 order
- Repeat customers: Customers with 2–4 orders (configurable)
- Loyal customers: Customers with 5+ orders (configurable threshold)
Available filters
- Date range selection (day, week, month, quarter, year)
- Customer segment filtering
- Customer role: segment the report by WordPress user role, or select Guests for orders placed without an account
- Product category: narrow the report to the customers who bought from one or more product categories, matching those who ever purchased from them, only ever purchased from them, or first purchased from them, and requiring any or all of the selected categories; this selects which customers are reported, not which sales are counted
- Currency: on stores that have taken orders in more than one currency, report on a single currency, or on all of them converted to your store currency at the rates set in the settings; a single currency covers that currency’s orders alone, so counts and dates follow them too
Data Export: CSV download available for all table data
4. Active Customer Value
↑ Back to topHow many of my customers are still active, and what are they worth on average?
Location: WooCommerce → Analytics → Customer Analytics → Active Customer Value tab
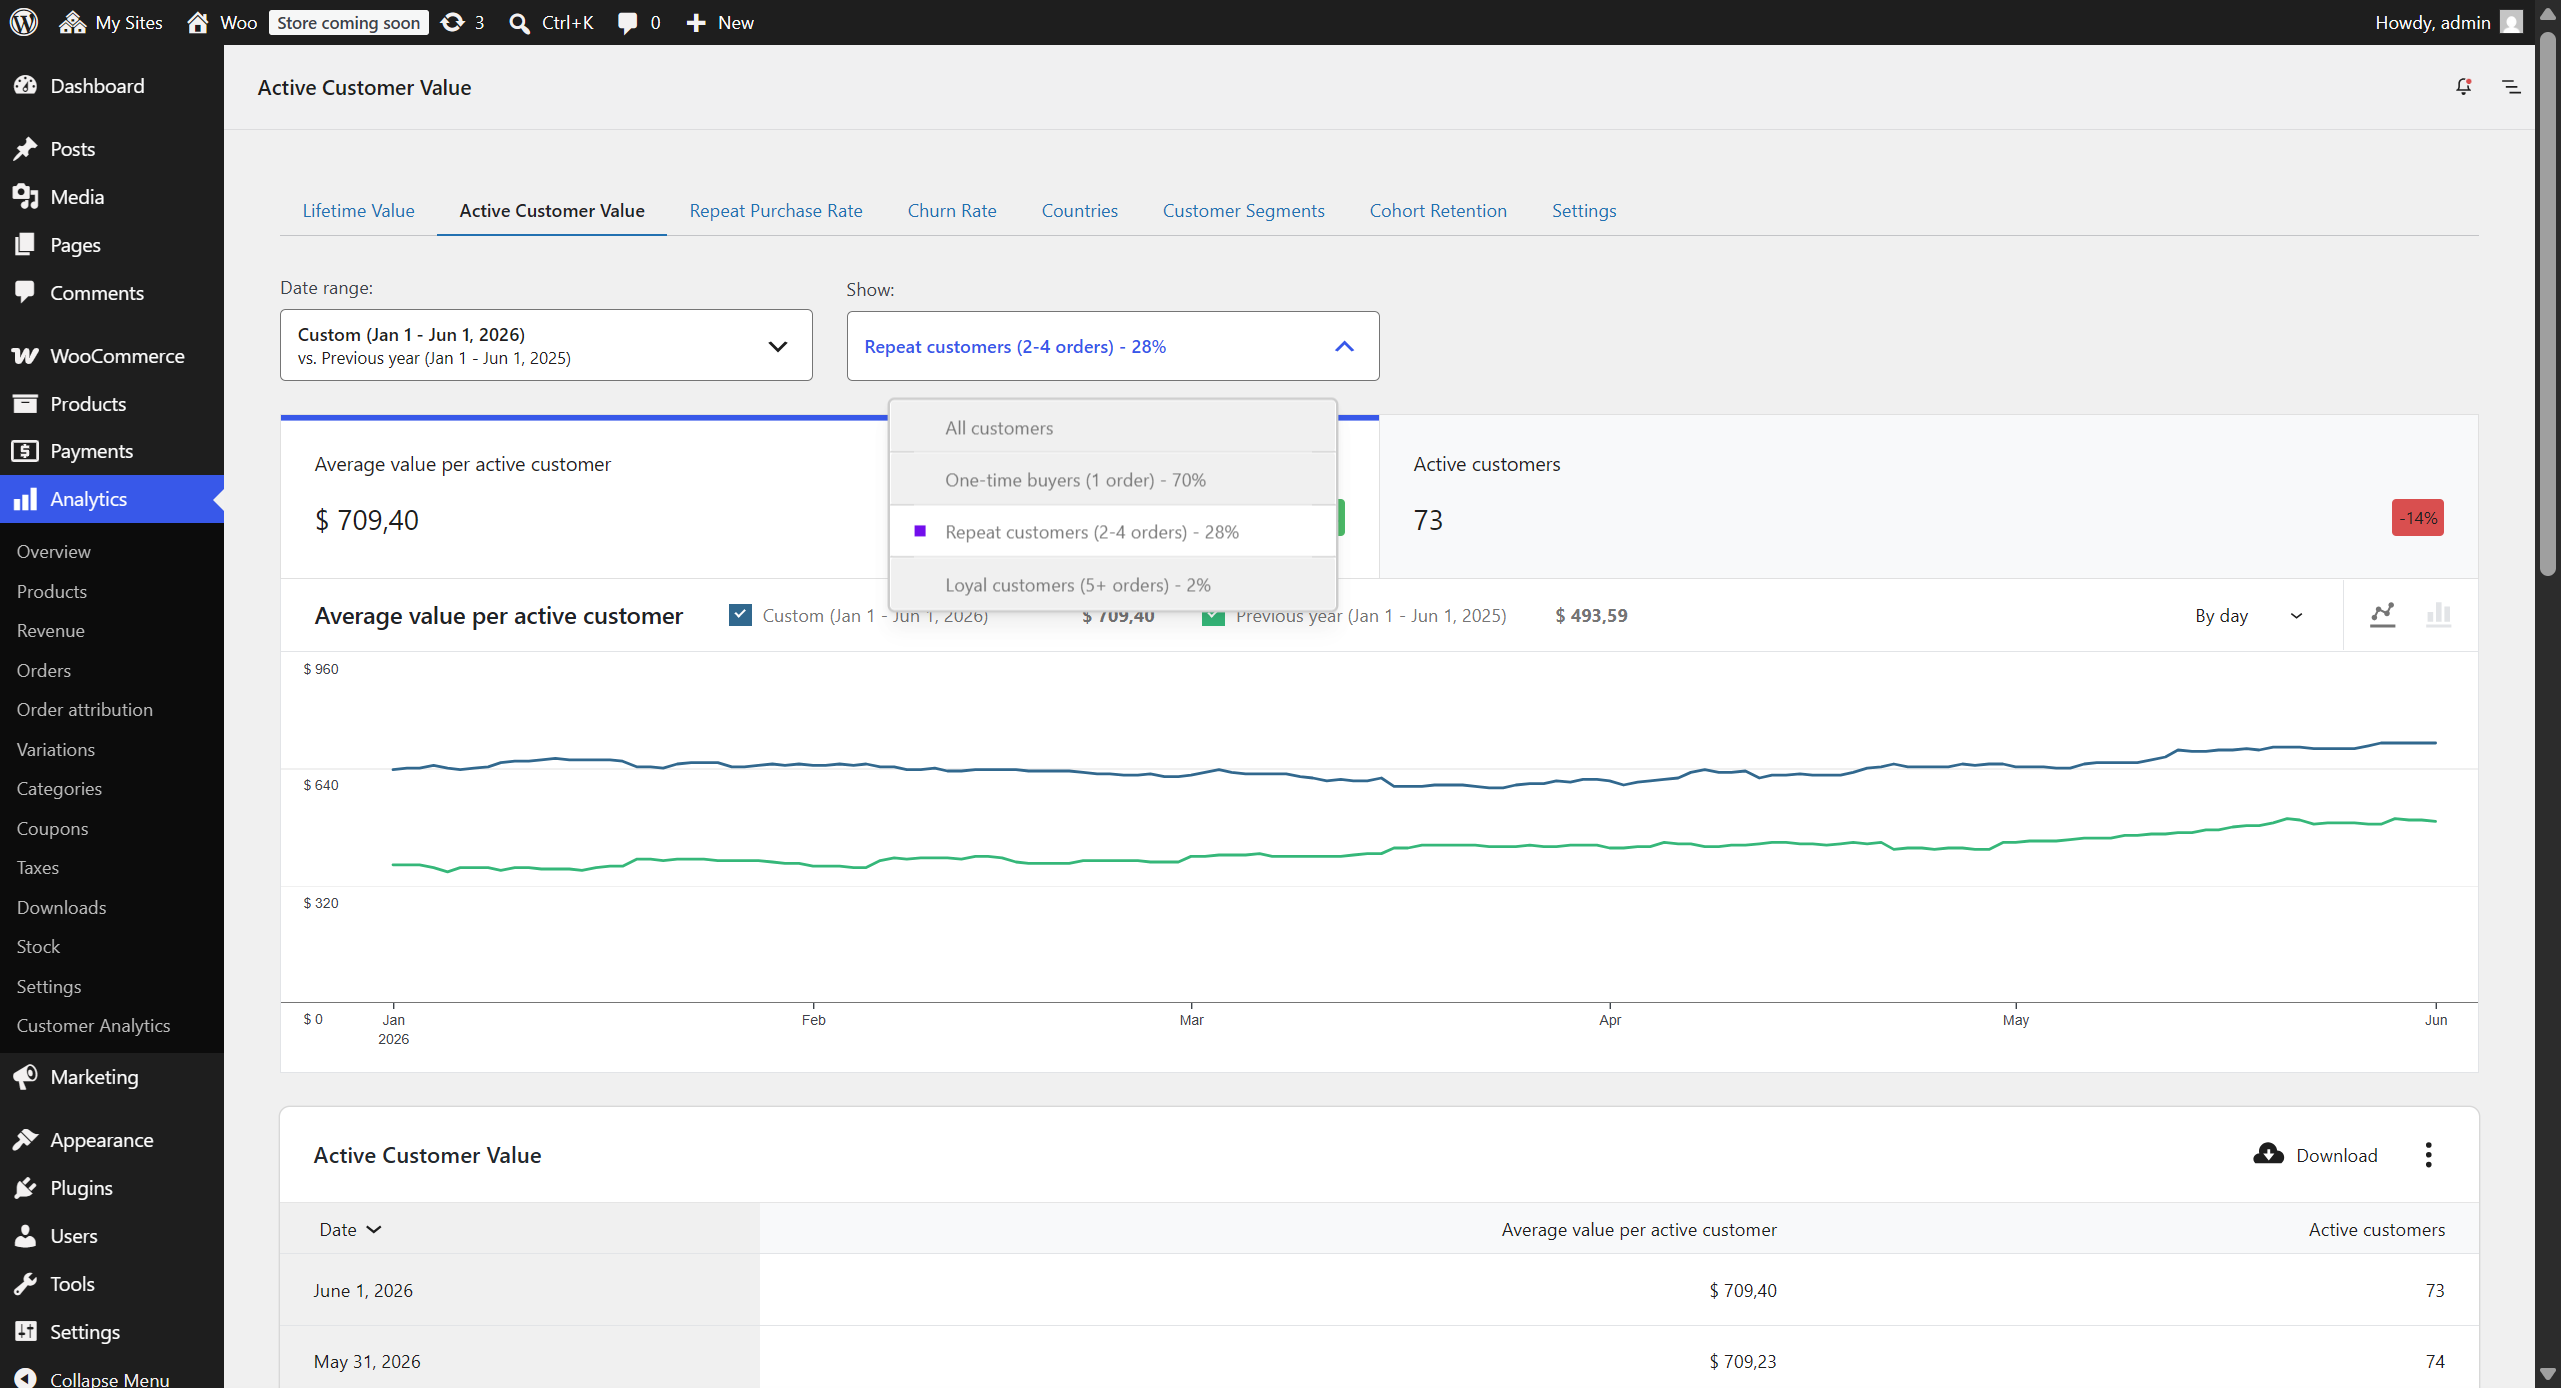
Track the size and value of your active customer base over time. At each interval the report looks at the customers who were active within the saved Churn period (default 90 days) and reports how many there are and the average value per active customer, so the trend reflects your currently-engaged base rather than a flat all-time average.
Metrics displayed
- Active customers: Number of customers who placed an order within the saved Churn period before each interval. This is your engaged base, and the headline trend of this report
- Average value per active customer: Average lifetime spend (to date) of those active customers
- Average tenure of active customers (months): Average time since first order among the active customers (shown in the summary; the per-interval value largely tracks elapsed calendar time, so it is not charted)
Important notes
- Calculations are based on order creation date
- Refunds are subtracted from lifetime value (a fully refunded order nets to zero), matching WooCommerce
- Guest orders are grouped by billing email address
Special features
- Lookback Period: Configure how many months of historical data to include
- Historical Tracking: Monitor CLV changes over time
- Segmentation: Same customer segments as standard CLV report
Configuration options
- Loyal customer threshold (default: 5 orders)
- Lookback period in months (optional, uses all data if empty)
- Customer role: segment the report by WordPress user role, or select Guests for orders placed without an account
- Product category: narrow the report to the customers who bought from one or more product categories, matching those who ever purchased from them, only ever purchased from them, or first purchased from them, and requiring any or all of the selected categories; this selects which customers are reported, not which sales are counted
- Currency: on stores that have taken orders in more than one currency, report on a single currency, or on all of them converted to your store currency at the rates set in the settings; a single currency covers that currency’s orders alone, so counts and dates follow them too
Lifetime Value vs. Active Customer Value: which report to use
↑ Back to topThe Lifetime Value and Active Customer Value reports use fundamentally different methodologies, which is why they may show different values for the same date range.
Lifetime Value (cohort-based)
- Includes only customers who made their first purchase within the selected date range
- Tracks their behavior over their entire lifetime (including beyond the report period)
- Reports each customer’s tenure (time since their first order); one-time buyers are included with their real tenure rather than an estimated value
- Perspective: Forward-looking cohort analysis, answering “How valuable are customers acquired in this period?”
Active Customer Value (snapshot-based)
- Includes only customers who were active (placed an order within the saved Churn period) at each point in time
- Shows the size and value of your engaged customer base at each interval, so the trend actually moves
- Perspective: Health check of the active base, answering “How many engaged customers do I have right now and how valuable are they?”
Customer segment percentages
The two reports also calculate segment percentages (one-time, repeat, loyal) differently:
- Lifetime Value: Counts all orders each cohort customer has made up to today. Shows how the acquisition cohort has evolved (e.g., “40% of January customers became loyal”).
- Active Customer Value: Counts each customer’s lifetime orders, but only for customers who were active (placed an order within your churn period) as of the end of the selected date range. Shows the behavior mix of your active base at that point in time (e.g., “25% of your active customers were loyal as of January 2024”).
When to use each report
Use Lifetime Value when you want to:
- Analyze the quality of customer acquisitions from specific periods
- Track how cohorts evolve over their entire lifetime
- Compare acquisition performance across different time periods
Use Active Customer Value when you want to:
- See historical snapshots of your active customer base
- Track overall business health over time
- Understand customer composition at specific points in history
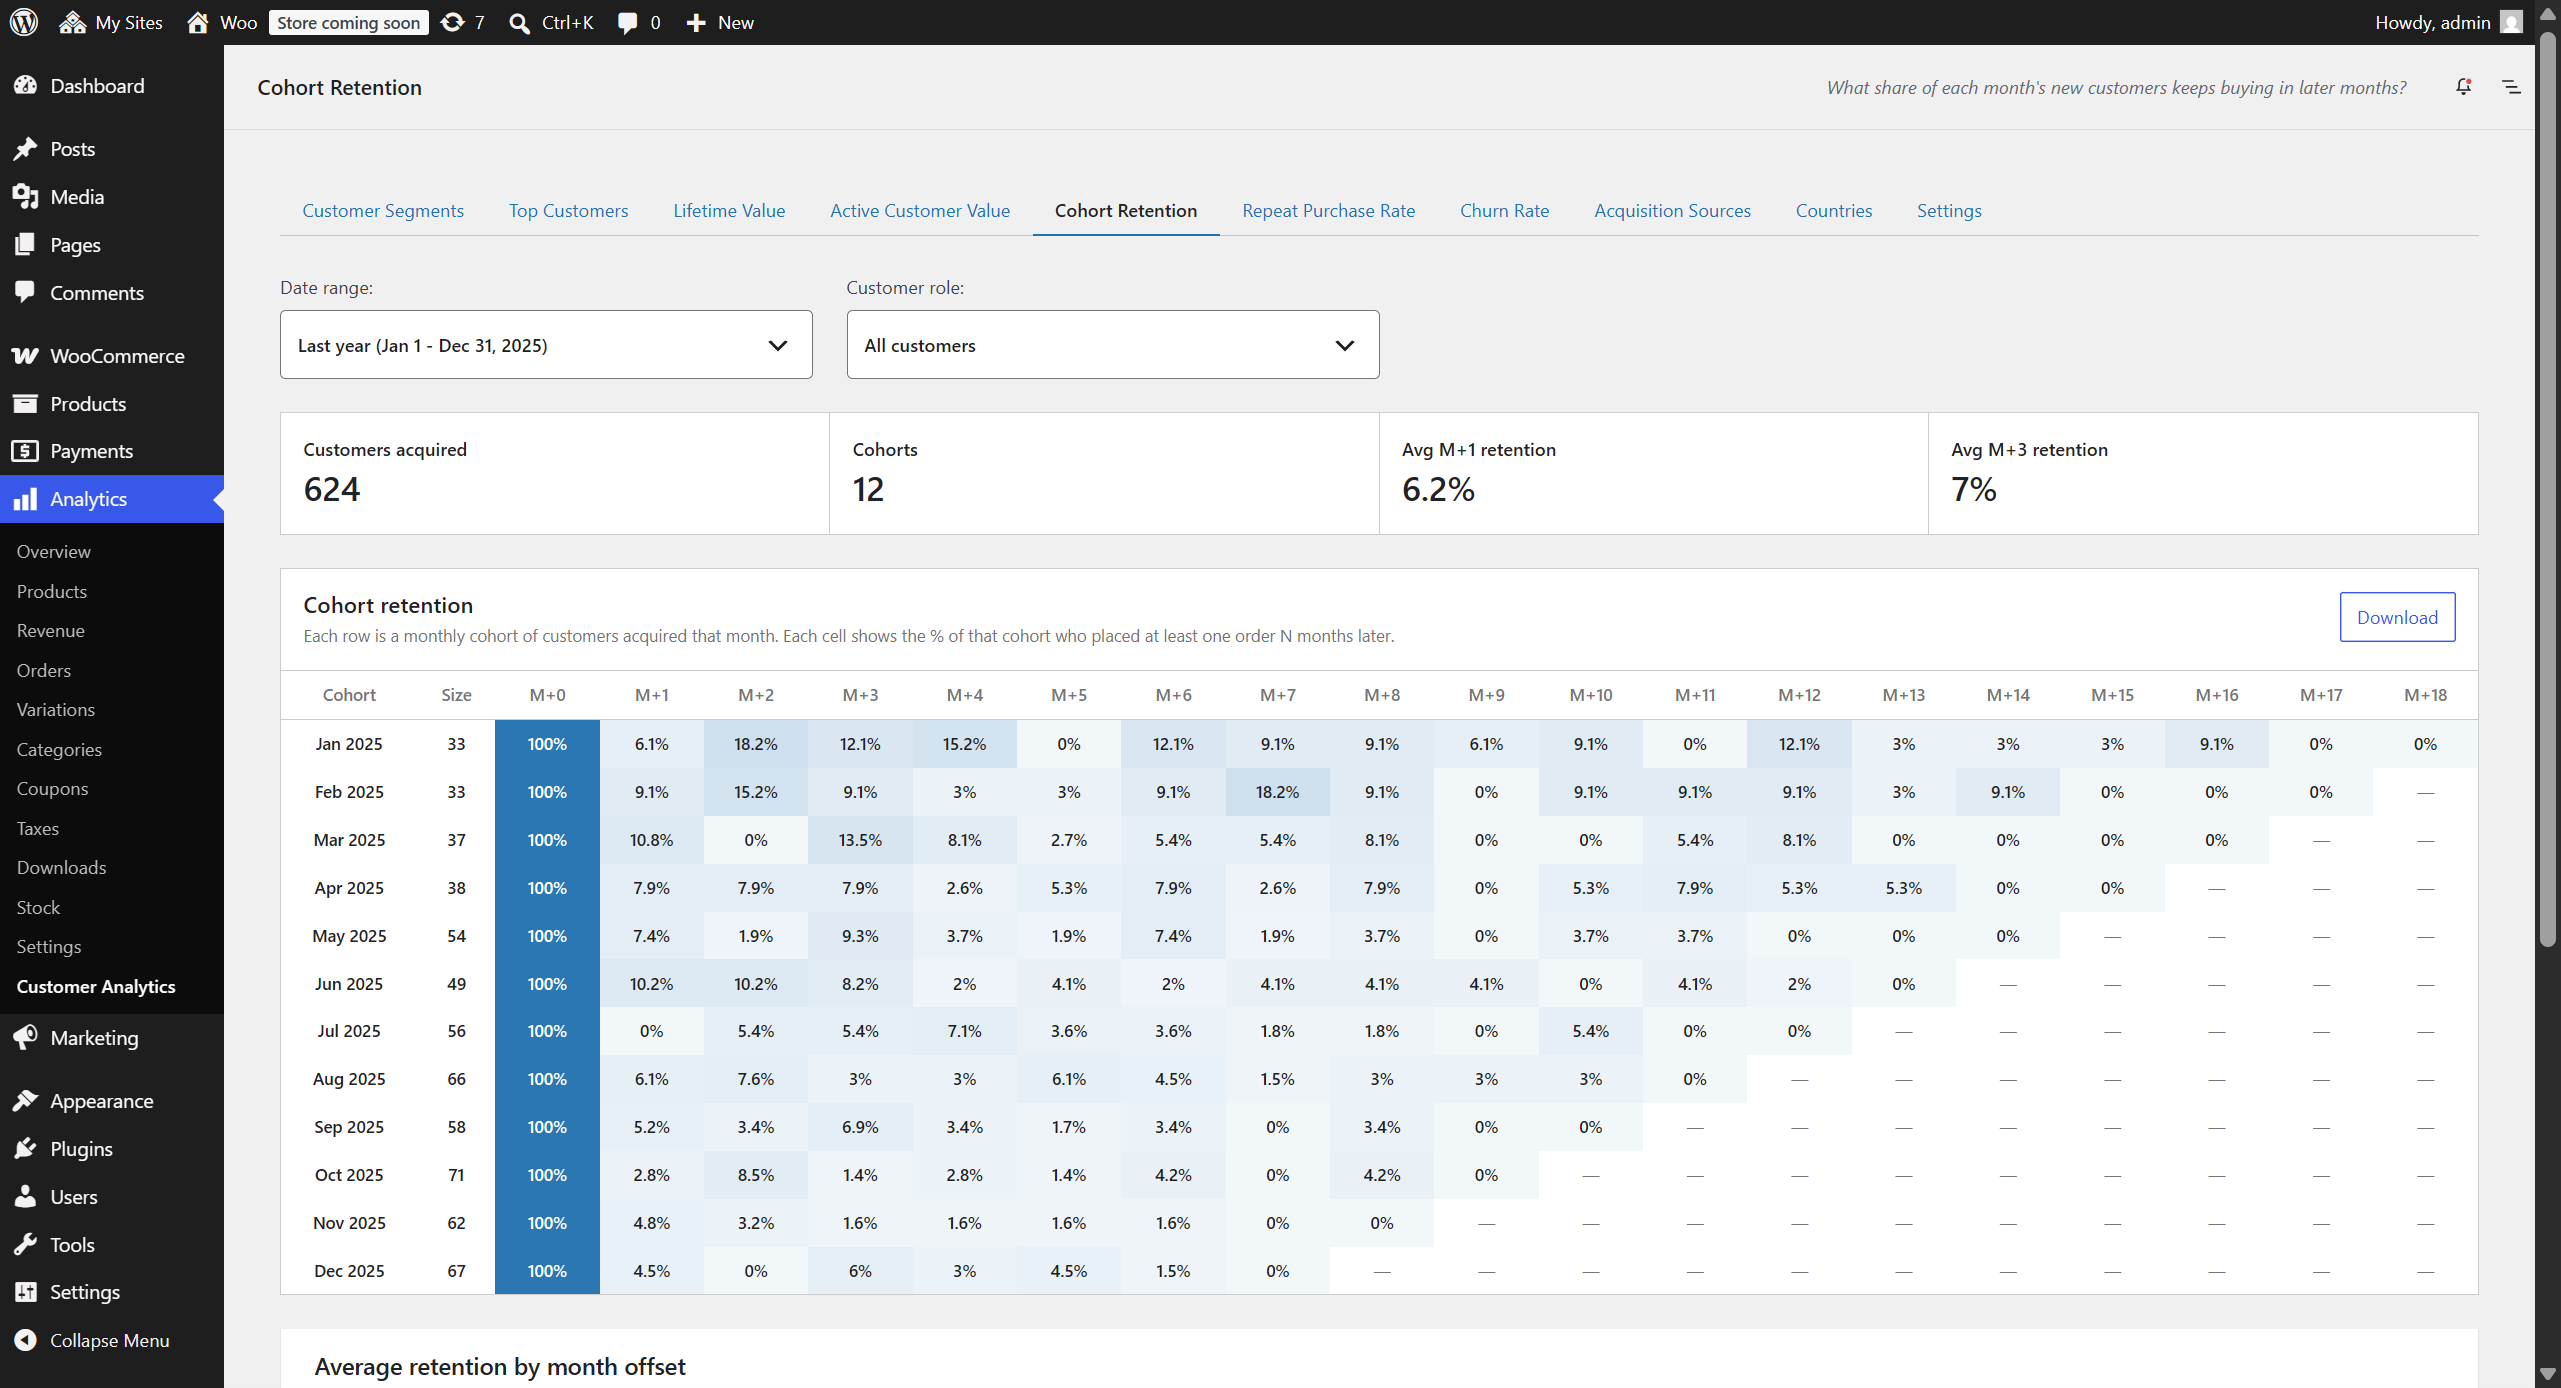
5. Cohort Retention
↑ Back to topWhat share of each month’s new customers keeps buying in later months?
Location: WooCommerce → Analytics → Customer Analytics → Cohort Retention tab
See how well you retain the customers you acquire, month by month. Customers are grouped into monthly cohorts by the month of their first order, and the report tracks each cohort’s ordering activity over the following months.
What is displayed
- Cohort retention heatmap: One row per monthly cohort with its size (customers acquired that month) and one column per month offset (M+0, M+1, M+2…). Each cell shows the percentage of the cohort who placed at least one order that many months after acquisition, shaded so retention patterns stand out. M+0 is always 100% (every cohort member ordered in their acquisition month). Months a cohort has not reached yet show a dash, as does the current month while it is still in progress
- Average retention by month offset: A chart averaging the cohorts’ retention at each offset, useful for spotting where the typical drop-off happens. It starts at M+1, because M+0 is always 100% and plotting it would flatten every other bar against the axis, and it ends at the last complete calendar month, because the current one is still in progress. Each month is averaged over only the cohorts old enough to have reached it, so the later months rest on fewer cohorts. Hover a bar to see how many
- Summary cards: Customers acquired in the range, number of cohorts, and average M+1 and M+3 retention across cohorts that have reached those offsets
How retention is measured
The selected date range chooses which acquisition months appear as cohort rows. Retention itself is always observed up to the end of the last complete calendar month, not just to the end of the range. A cohort acquired within the range gets credit for orders its customers placed after the range ended. The month in progress is left out until it completes, because a cell measured over part of a month is not comparable to the full months beside it. A customer counts as retained in month M+N if they placed at least one qualifying order in the Nth calendar month after their acquisition month.
Important notes
- A customer belongs to the cohort of their first-ever order, so someone who bought before the selected range is never counted as newly acquired within it
- Calculations use order creation date; fully refunded orders are excluded (a refund isn’t a real purchase), matching the other behavioral reports
- Guest orders are grouped by billing email address
- The average retention per offset is an unweighted average across cohorts, so small and large cohorts count equally
- The calendar month in progress is not counted until it completes, so every cell and every average covers a full month of opportunity. Without this, the same partial month would sit at the end of every cohort’s row and pull down all of the figures
Filters
- Date range selection (picks the acquisition months shown as cohort rows)
- Customer role: segment the report by WordPress user role, or select Guests for orders placed without an account
- Product category: narrow the report to the customers who bought from one or more product categories, matching those who ever purchased from them, only ever purchased from them, or first purchased from them, and requiring any or all of the selected categories; this selects which customers are reported, not which sales are counted
- Currency: on stores that have taken orders in more than one currency, report on a single currency, or on all of them converted to your store currency at the rates set in the settings; a single currency covers that currency’s orders alone, so counts and dates follow them too
Data Export: CSV download of the full cohort matrix (cohort, size, and every M+N column)
6. Repeat Purchase Rate
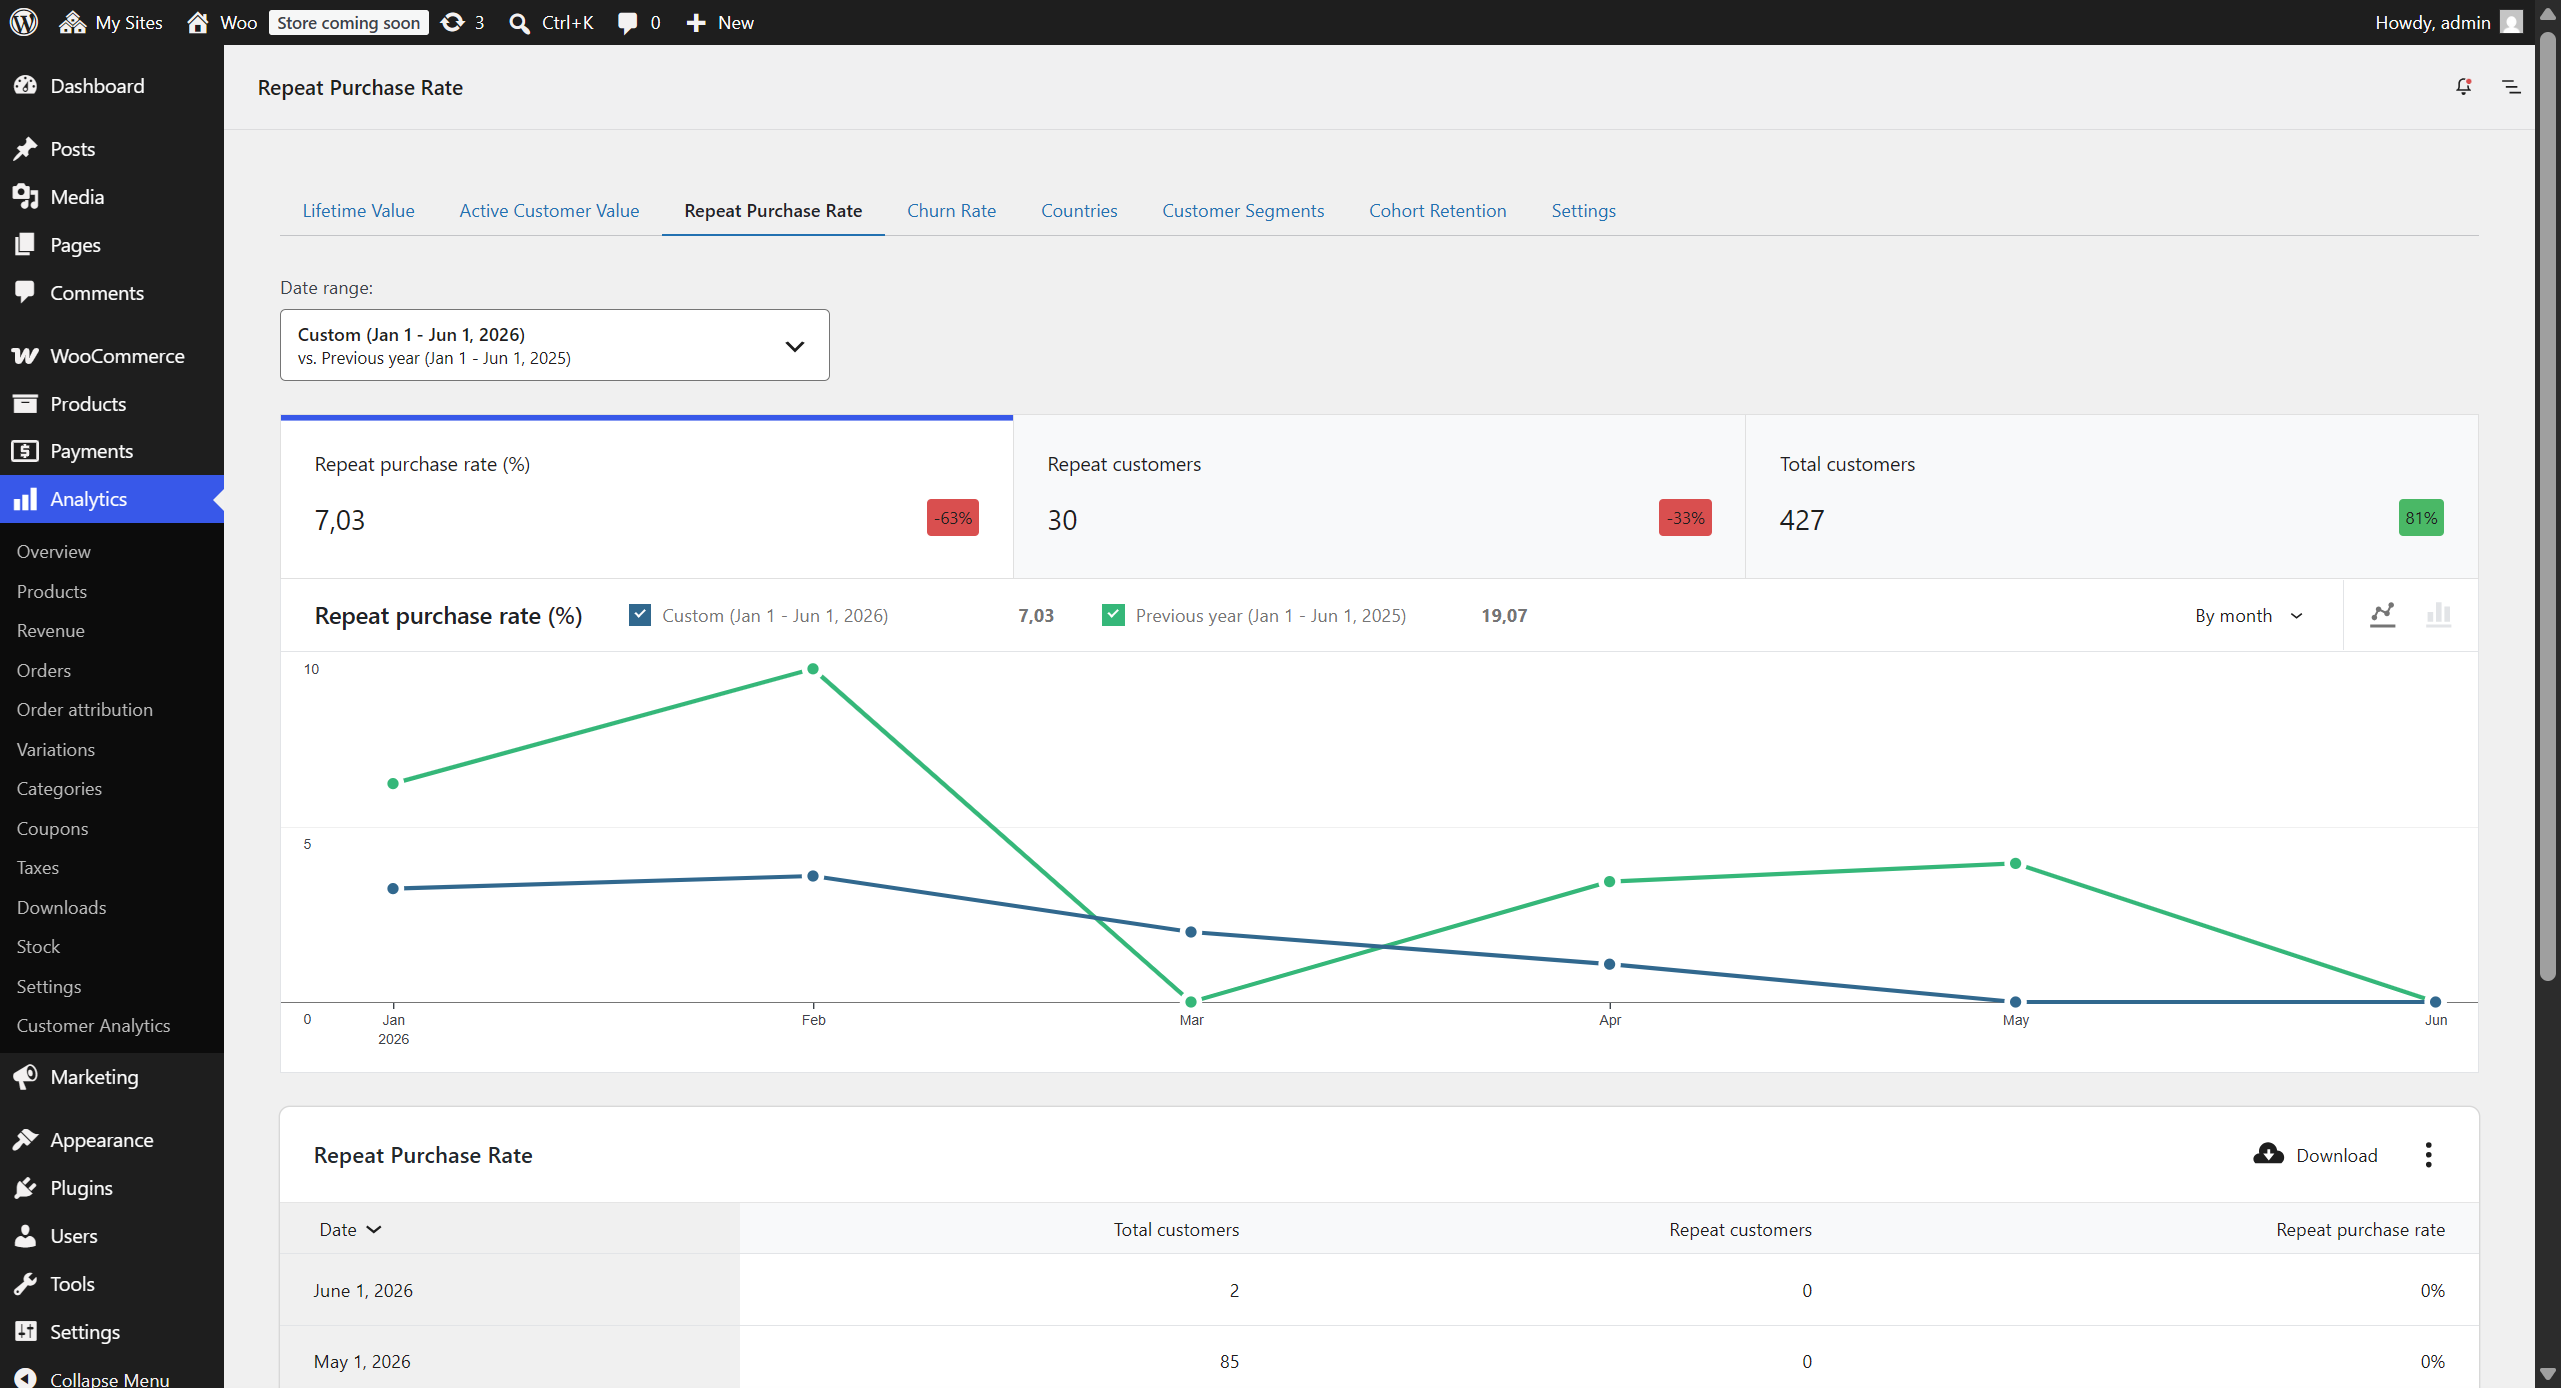
↑ Back to topWhat percentage of my customers order more than once in the same period?
Location: WooCommerce → Analytics → Customer Analytics → Repeat Purchase Rate tab
Measure the percentage of customers who make multiple purchases.
Metrics displayed
- Repeat purchase rate (%): Percentage of customers with 2+ orders within the period
- Repeat customers: Absolute count of customers who ordered more than once within the period
- Total customers: Complete customer count for the period
Important notes
- Based on order creation date for tracking customer activity
- Fully refunded orders are excluded from the analysis
- Repeat purchase rate in chart/table summary is an overall repeat purchase rate for the selected period
Tip: If you have insufficient data points for the selected interval (e.g., very few daily data points), try selecting a longer interval like “month” instead of “day” for more meaningful analysis.
Analysis features
- Time-series visualization of repeat purchase trends
- Period-over-period comparisons
- Downloadable data for external analysis
Filters
- Date range selection
- Interval grouping (hour, day, week, month, quarter, year)
- Customer role: segment the report by WordPress user role, or select Guests for orders placed without an account
- Product category: narrow the report to the customers who bought from one or more product categories, matching those who ever purchased from them, only ever purchased from them, or first purchased from them, and requiring any or all of the selected categories; this selects which customers are reported, not which sales are counted
- Currency: on stores that have taken orders in more than one currency, report on a single currency, or on all of them converted to your store currency at the rates set in the settings; a single currency covers that currency’s orders alone, so counts and dates follow them too
7. Order Sequence
↑ Back to topHow many first-time buyers come back, how far do they go, and how long does each step take?
Location: WooCommerce → Analytics → Customer Analytics → Order Sequence tab
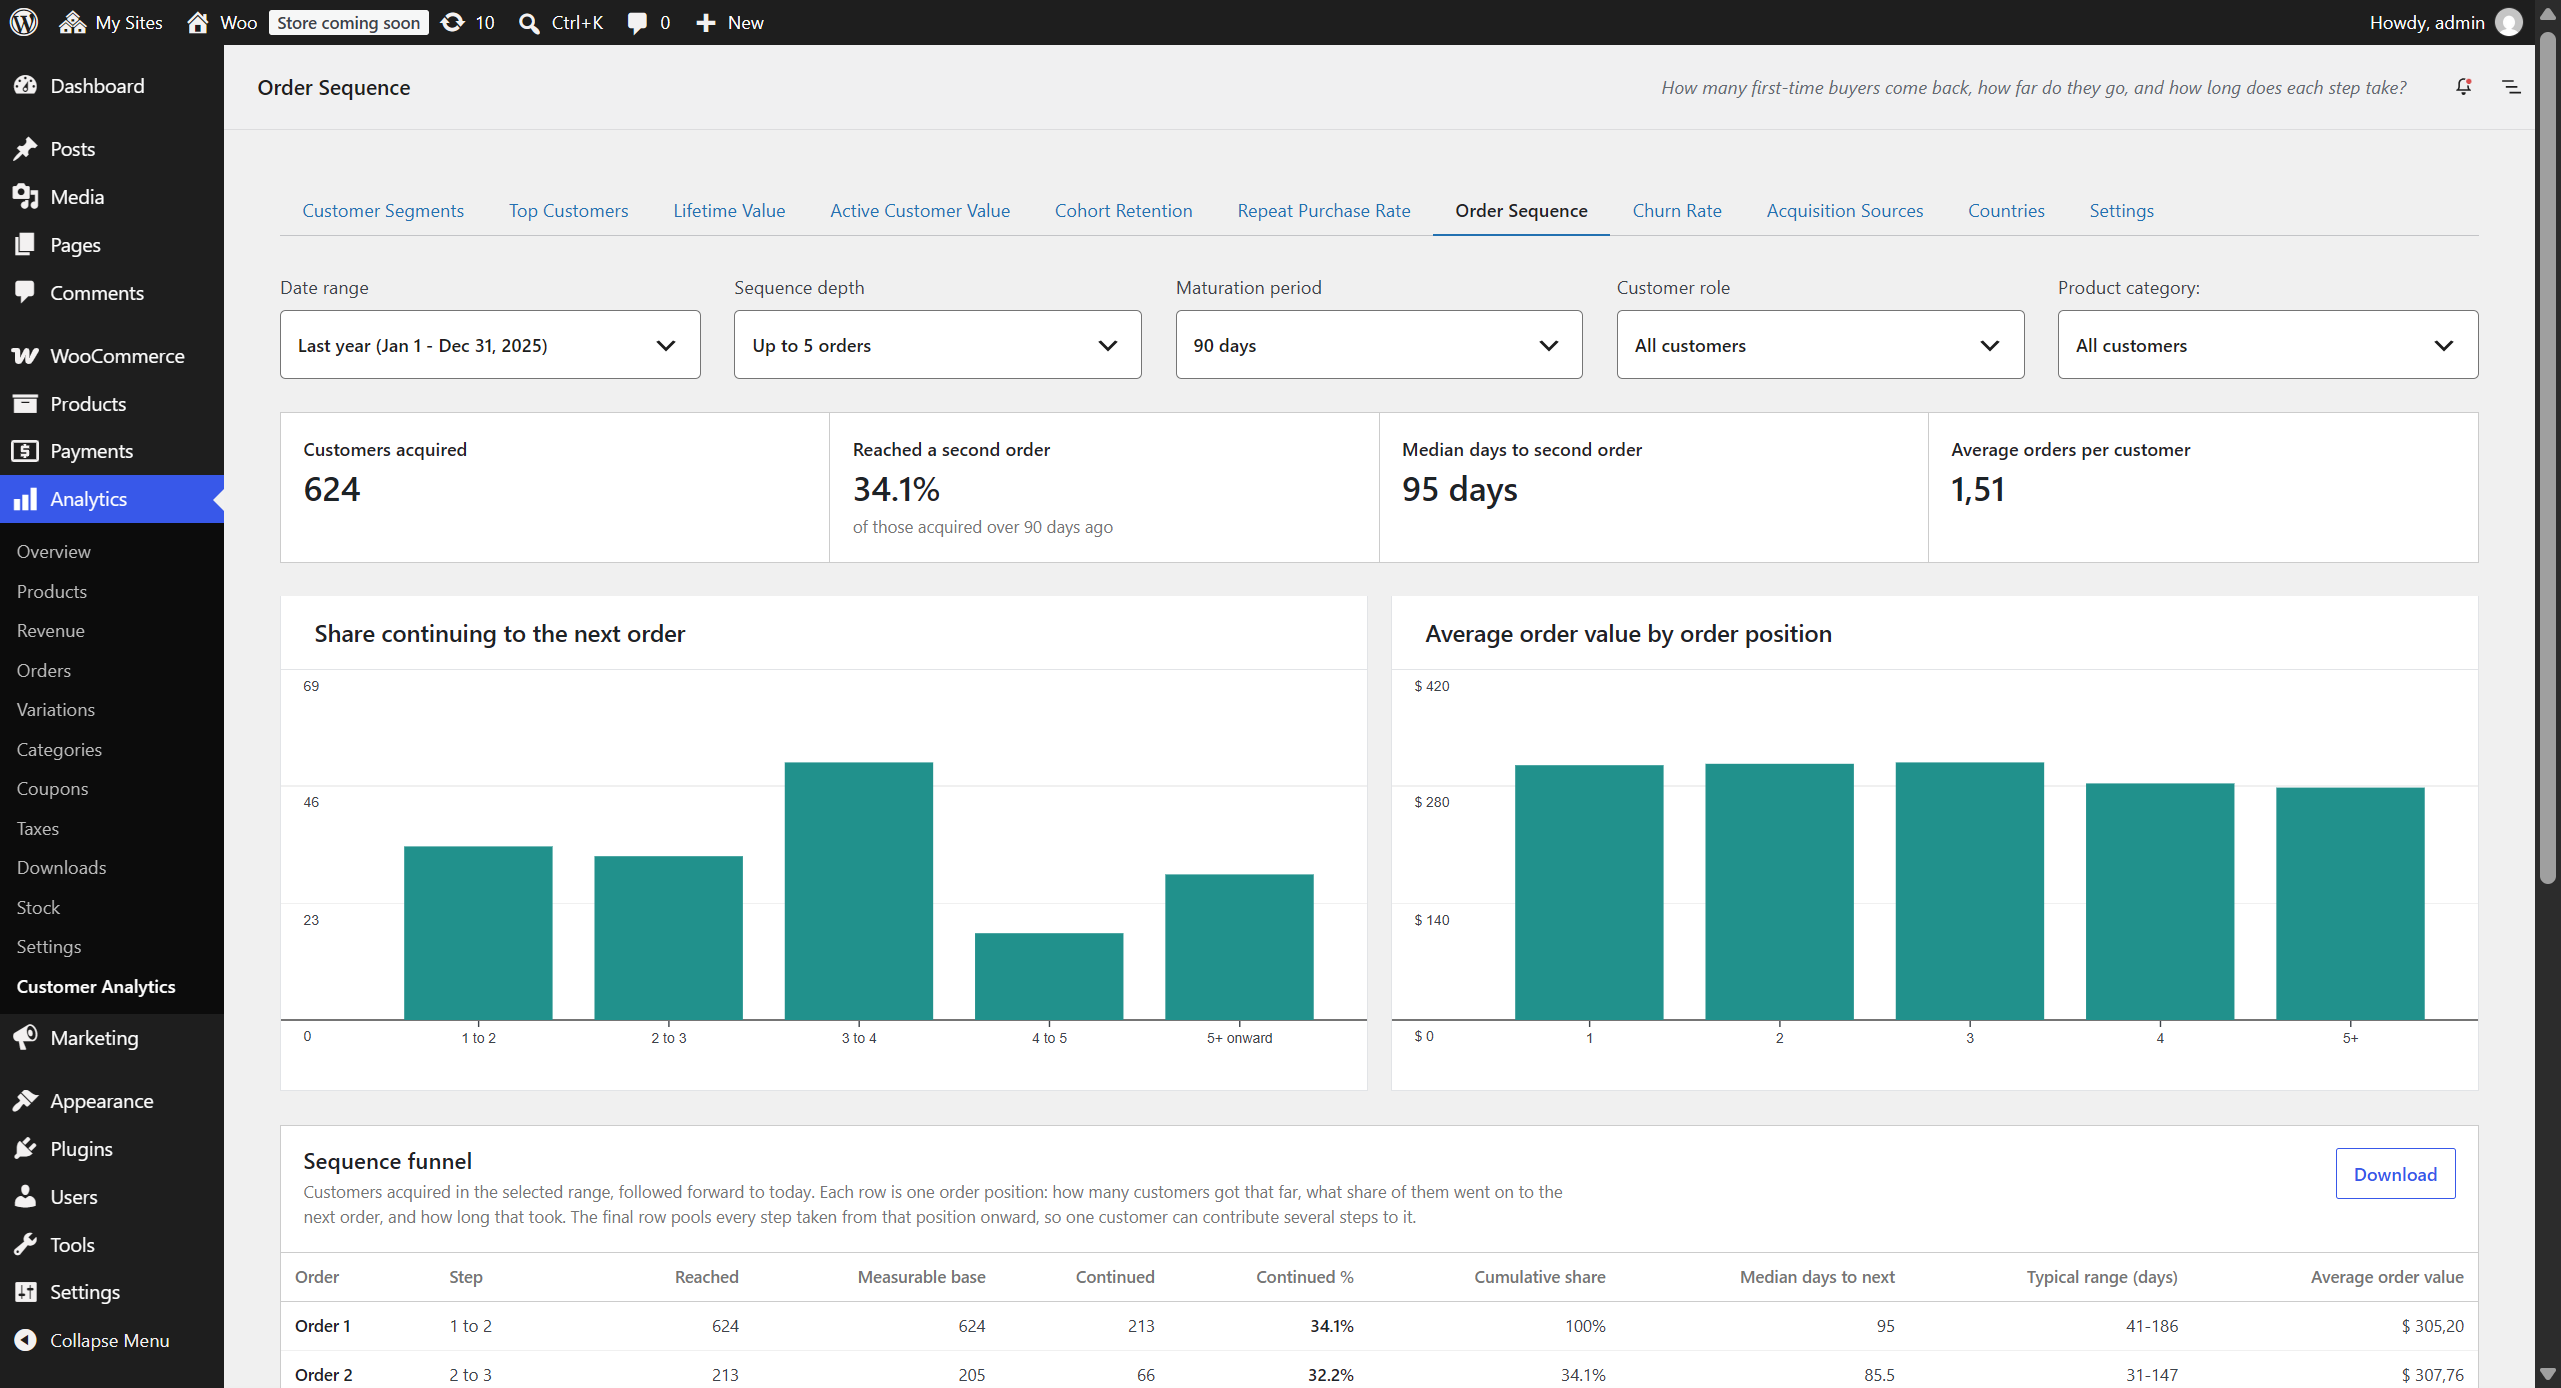
Follow the customers you acquired in a date range forward to today and see where they fall away. Rather than a single retention percentage, this report breaks the relationship into its individual steps: the share who go on to a second order, then a third, then a fourth, how long each of those steps takes, and what the order at each position is worth. A store that struggles to win the second order needs a different response from one that wins it easily and then loses people at the fourth, and this is the report that tells the two apart.
What is displayed
- Sequence funnel: One row per order position, ending in a pooled tail row, with the customers who reached it, the base that could be measured, how many continued to the next order, the continuation percentage, the cumulative share still in the sequence, the median and typical range of days to the next order, and the average value of the order at that position
- Charts: The share continuing to the next order at each step, beside the average order value at each position. Reading them together is the point, because a funnel that narrows while the value per order climbs calls for something quite different from one where both fall away
- Days between orders: A shaded grid showing how the wait before the next order is spread out at each position, as a percentage of the steps taken from it. A median of seven weeks hides whether returns cluster tightly around that point or split into a fast group and a slow one, and those two stores need different campaigns
- Summary cards: Customers acquired in the range, the share who reached a second order, the median days to that second order, and the average number of orders per customer
How values are measured
The date range is an acquisition window: the customers shown are those whose first order falls inside it. Their sequence is then followed forward to today, past the end of the range, because the whole subject of the report is what happens after the first order. Order positions are lifetime positions, so order three means a customer’s third order ever.
Customers who bought too recently to have had a fair chance to return are held out of the funnel rather than counted as failures. A step counts only once the order it starts from is older than the maturation period, which defaults to your churn period and can be changed on the page, including switching it off. Anyone in that base who came back counts, no matter how long they took. The report states above the funnel how many customers this is holding out, so the exclusion is never silent.
That figure is counted at the first order: it is the customers whose first order is younger than the maturation period, and they are the ones missing from the order one to two step. The same window applies at every later step as well, and holds back customers the figure never counts, such as somebody acquired two years ago whose third order was placed last week. Where that happens, the measurable base column is smaller than the customers reached column, and the difference is the customers whose order at that position is still too recent to measure. A recent date range therefore does not report a lower continuation rate simply for being recent.
The final row pools every step taken from that position onward, so one customer can contribute several steps to it. That makes its percentage a per-order continuation rate: given that somebody has reached that order, how often do they place another. The customers reached column stays a straight count of distinct customers on every row, including that one.
The cumulative share chains the step percentages together rather than dividing by the customers acquired, because each step is measured over its own base and mixing those bases would understate the deeper positions.
How this differs from Repeat Purchase Rate
The two reports are meant to be read together, and they will not agree. Repeat Purchase Rate is scoped to a period: it asks what share of the customers who ordered within a period ordered twice within that same period, so a customer who buys in January and again in February counts as a non-repeat customer in both months. Order Sequence is scoped to a cohort: the date range picks customers by the date of their first order, and everything they went on to do counts no matter when it happened.
Order Sequence will normally report the higher figure. That is expected, not a discrepancy. Use Repeat Purchase Rate to watch a period-over-period trend, and Order Sequence to understand the shape of the customer journey behind it.
Important notes
- Fully refunded orders are excluded, and here that does more than remove a figure: an excluded order never takes up a place in the sequence, so it cannot push every later order down a position. Partial refunds are subtracted from the average order value at the position where the order sits
- Rows measured over too few orders are named in a notice above the funnel and shown faded in the table. Only the derived figures are faded: the continuation percentage, the timings and the average order value. The counts beside them stay at full strength, because a count is exact however small and it is what tells you how thin the row is
- A row is called thin if any one of its figures rests on fewer orders than the report’s floor, which is 2% of the customers acquired in the selected range, and never fewer than two. A share rather than a fixed number, so the bar rises with the size of the cohort: twenty orders behind a step means something on a store with three hundred customers and nothing on a store with fifty thousand. The three figures do not share a base, so each is tested against the one it uses: the percentage over the customers whose order has matured, the timings over the steps that were actually completed, and the average order value over every order at that position. One flag covers the row, which can occasionally mute a sound figure sitting beside a thin one. A base of zero is not counted as thin, because there is no figure there to doubt: those cells show a dash
- The cumulative share is faded on every row below the first thin one, because it is built by chaining the percentages above it and inherits their uncertainty
- A position that customers reached, but only so recently that none of them can be measured yet, keeps its row and shows a dash instead of a percentage. It is not hidden. The cumulative share below such a row is a dash as well, because the chain has nothing to carry through it: those rows are unknown, not empty
- Cohorts that were acquired longer ago have had more time to come back, so the continuation percentages drift up slightly on older date ranges. The maturation period removes the customers who cannot be measured at all; it does not equalise the time available to those who can
- One maturation period applies to every step, although the wait before a second order is usually far longer than the wait before a fifth. Deriving a separate window for each step from that step’s own timings would make each figure depend on itself
- Guest orders are grouped by billing email, so a customer who checked out as a guest and later created an account is followed as one person provided the email matches
Filters
- Date range selection (picks which customers were acquired)
- Sequence depth: how many order positions to resolve before the remainder is pooled into the final row
- Maturation period: how long an order must have aged before the step starting from it is counted, defaulting to your churn period and including a None option
- Customer role: segment the report by WordPress user role, or select Guests for orders placed without an account
- Product category: narrow the report to the customers who bought from one or more product categories, matching those who ever purchased from them, only ever purchased from them, or first purchased from them, and requiring any or all of the selected categories; this selects which customers are reported, not which orders are counted
- Currency: on stores that have taken orders in more than one currency, report on a single currency, or on all of them converted to your store currency at the rates set in the settings; a single currency covers that currency’s orders alone, so counts and dates follow them too
Data Export: CSV download containing both the sequence funnel and the days-between-orders grid
8. Churn Rate
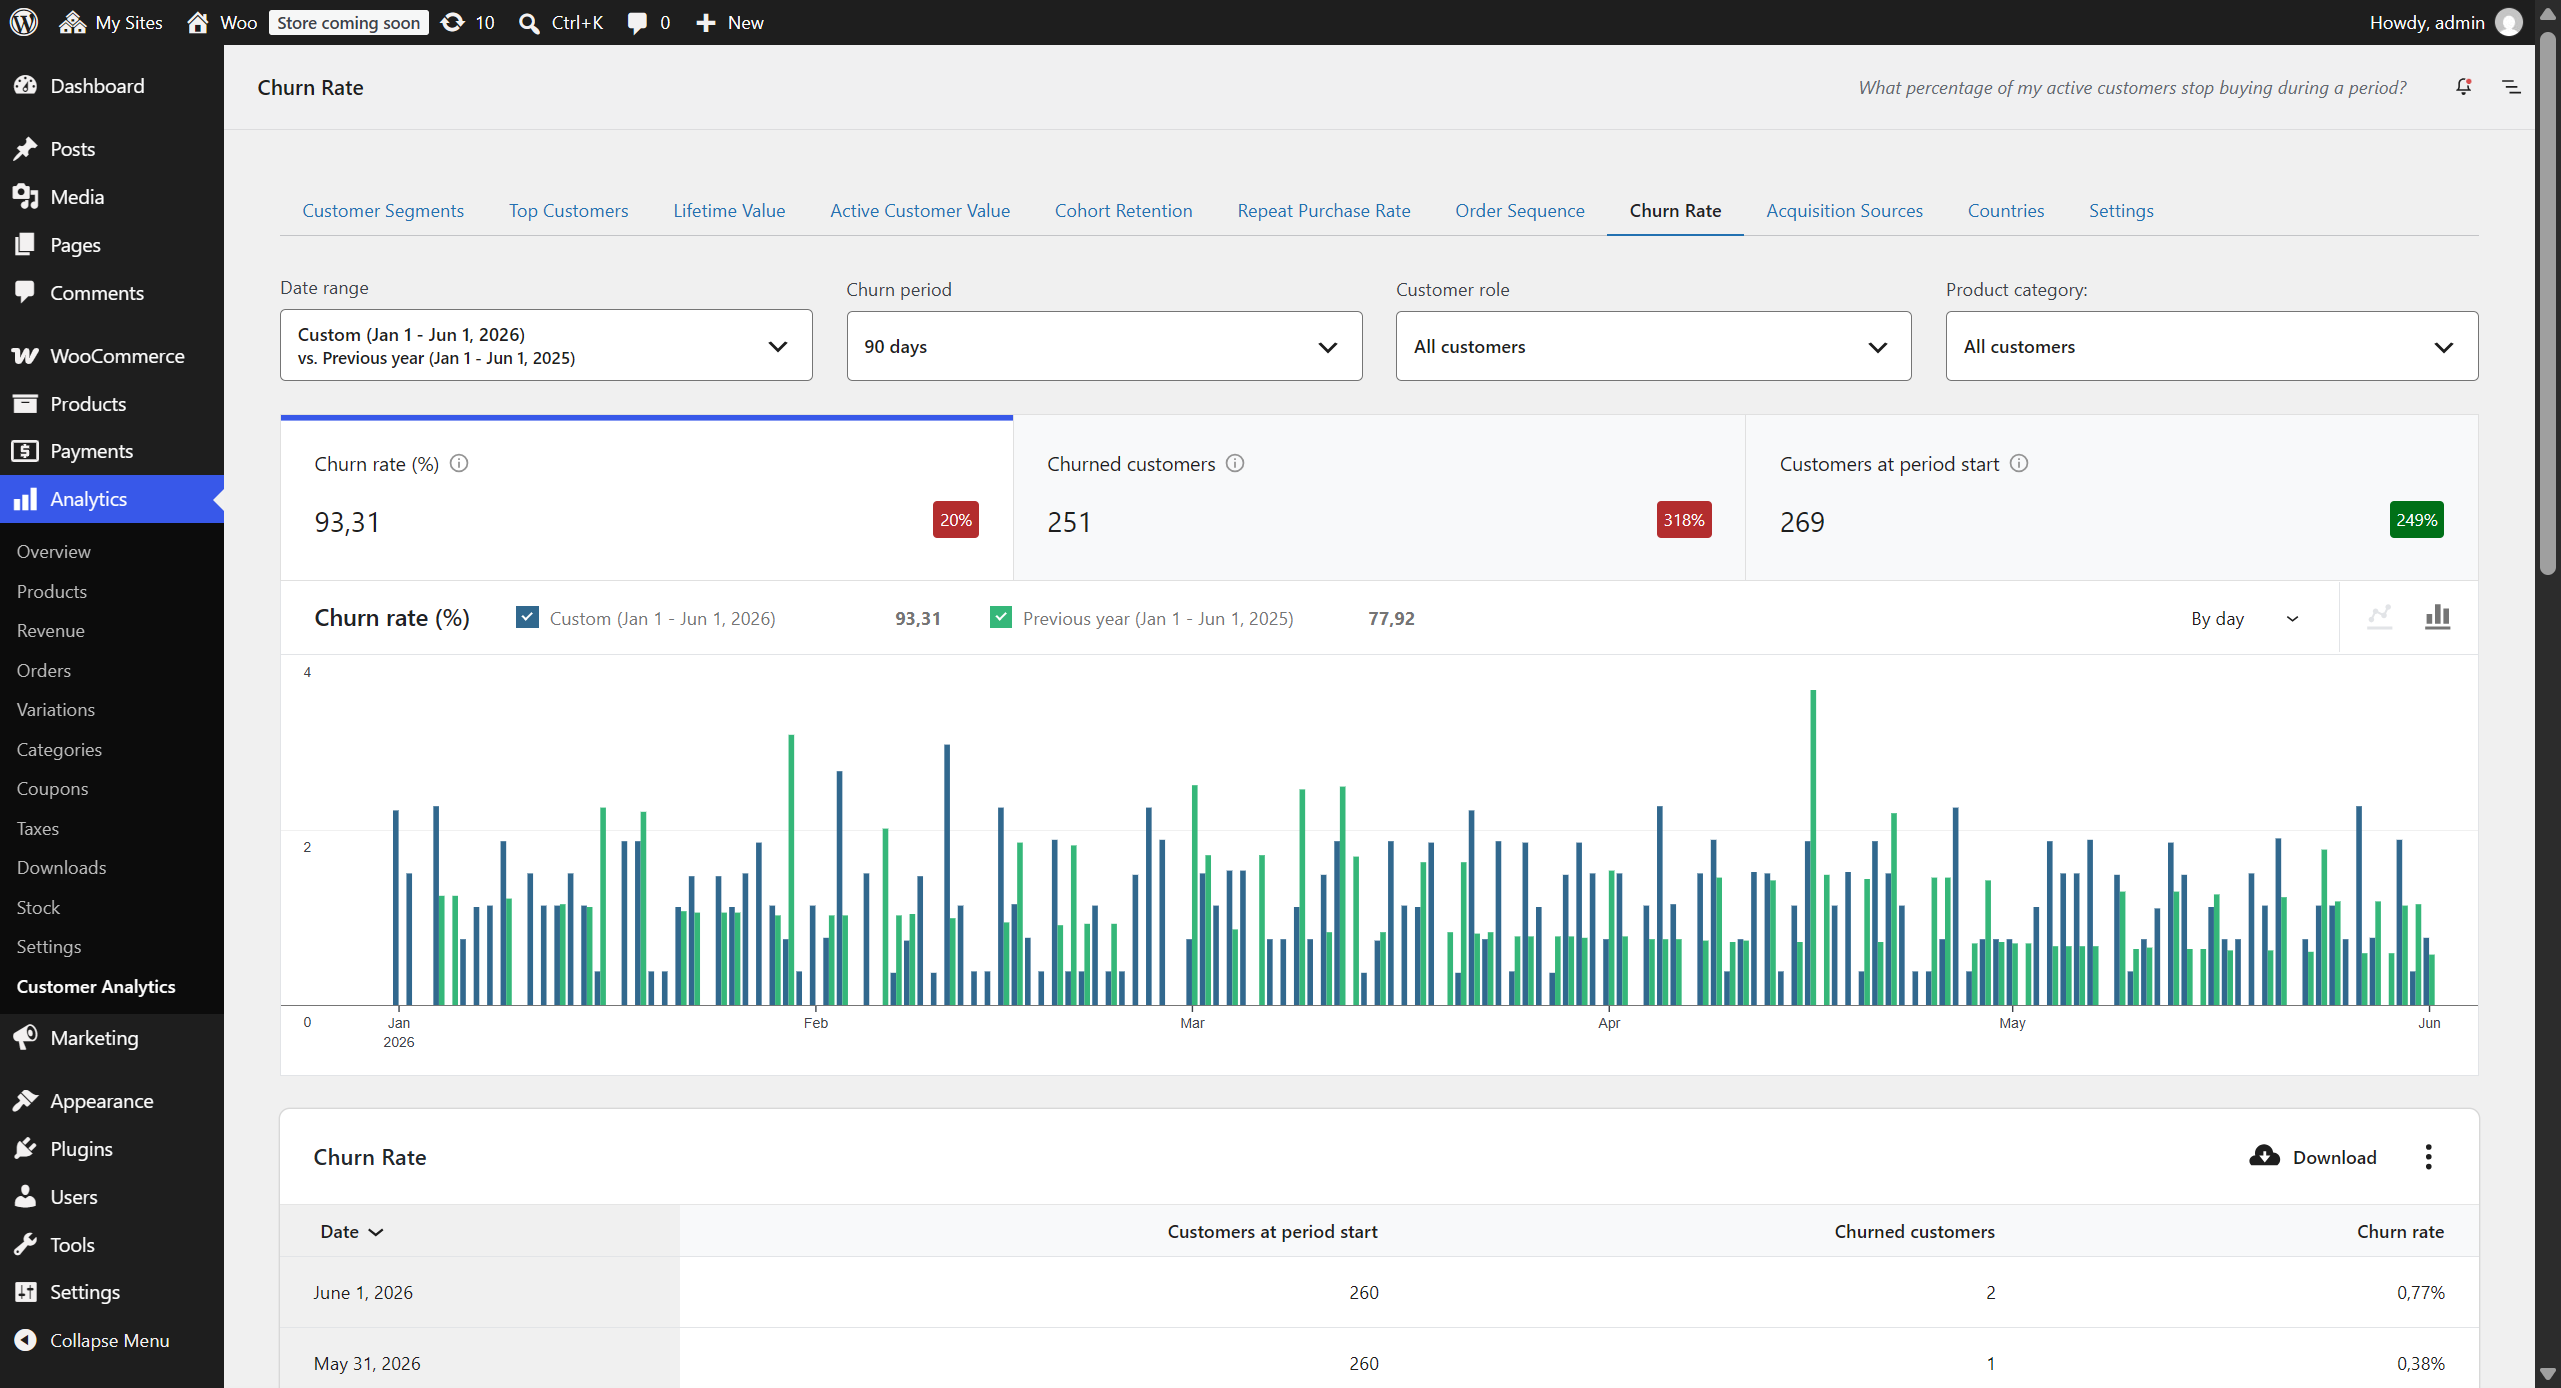
↑ Back to topWhat percentage of my active customers stop buying during a period?
Location: WooCommerce → Analytics → Customer Analytics → Churn Rate tab
Track customer attrition and identify when customers stop purchasing.
Metrics displayed
- Churn rate (%): Of the customers active at the start of each period, the percentage lost (stopped purchasing) during that period
- Churned customers: Number of those start-of-period active customers who became inactive during the period
- Customers at period start: Customers who were active (purchased within the churn period) at the start of each period. This is the base the churn rate is measured against
Important notes
- Churn calculations use order creation date to determine customer activity periods
- Fully refunded orders are not counted as valid purchases for churn analysis
- Churn is order-based, so it works for both one-time and subscription stores; a lapsed subscription shows up as renewal orders stopping
- The summary above the chart measures churn across the entire selected date range as a single period (of the customers active at the start of the range, the share who had lapsed by its end); it is anchored to the date range, so it stays stable when you change the chart interval (day/week/month)
Churn period options
- 15 days
- 30 days
- 60 days
- 90 days (default)
- 4 months (120 days)
- 6 months (180 days)
- 1 year (365 days)
- 2 years (730 days)
Analysis capabilities
- Trend analysis with reverse trend indicators (lower is better)
- Period comparison to identify seasonal patterns
- Customer role: segment the report by WordPress user role, or select Guests for orders placed without an account
- Product category: narrow the report to the customers who bought from one or more product categories, matching those who ever purchased from them, only ever purchased from them, or first purchased from them, and requiring any or all of the selected categories; this selects which customers are reported, not which sales are counted
- Currency: on stores that have taken orders in more than one currency, report on a single currency, or on all of them converted to your store currency at the rates set in the settings; a single currency covers that currency’s orders alone, so counts and dates follow them too
9. Acquisition Sources
↑ Back to topWhich marketing channels bring customers who come back?
Location: WooCommerce → Analytics → Customer Analytics → Acquisition Sources tab
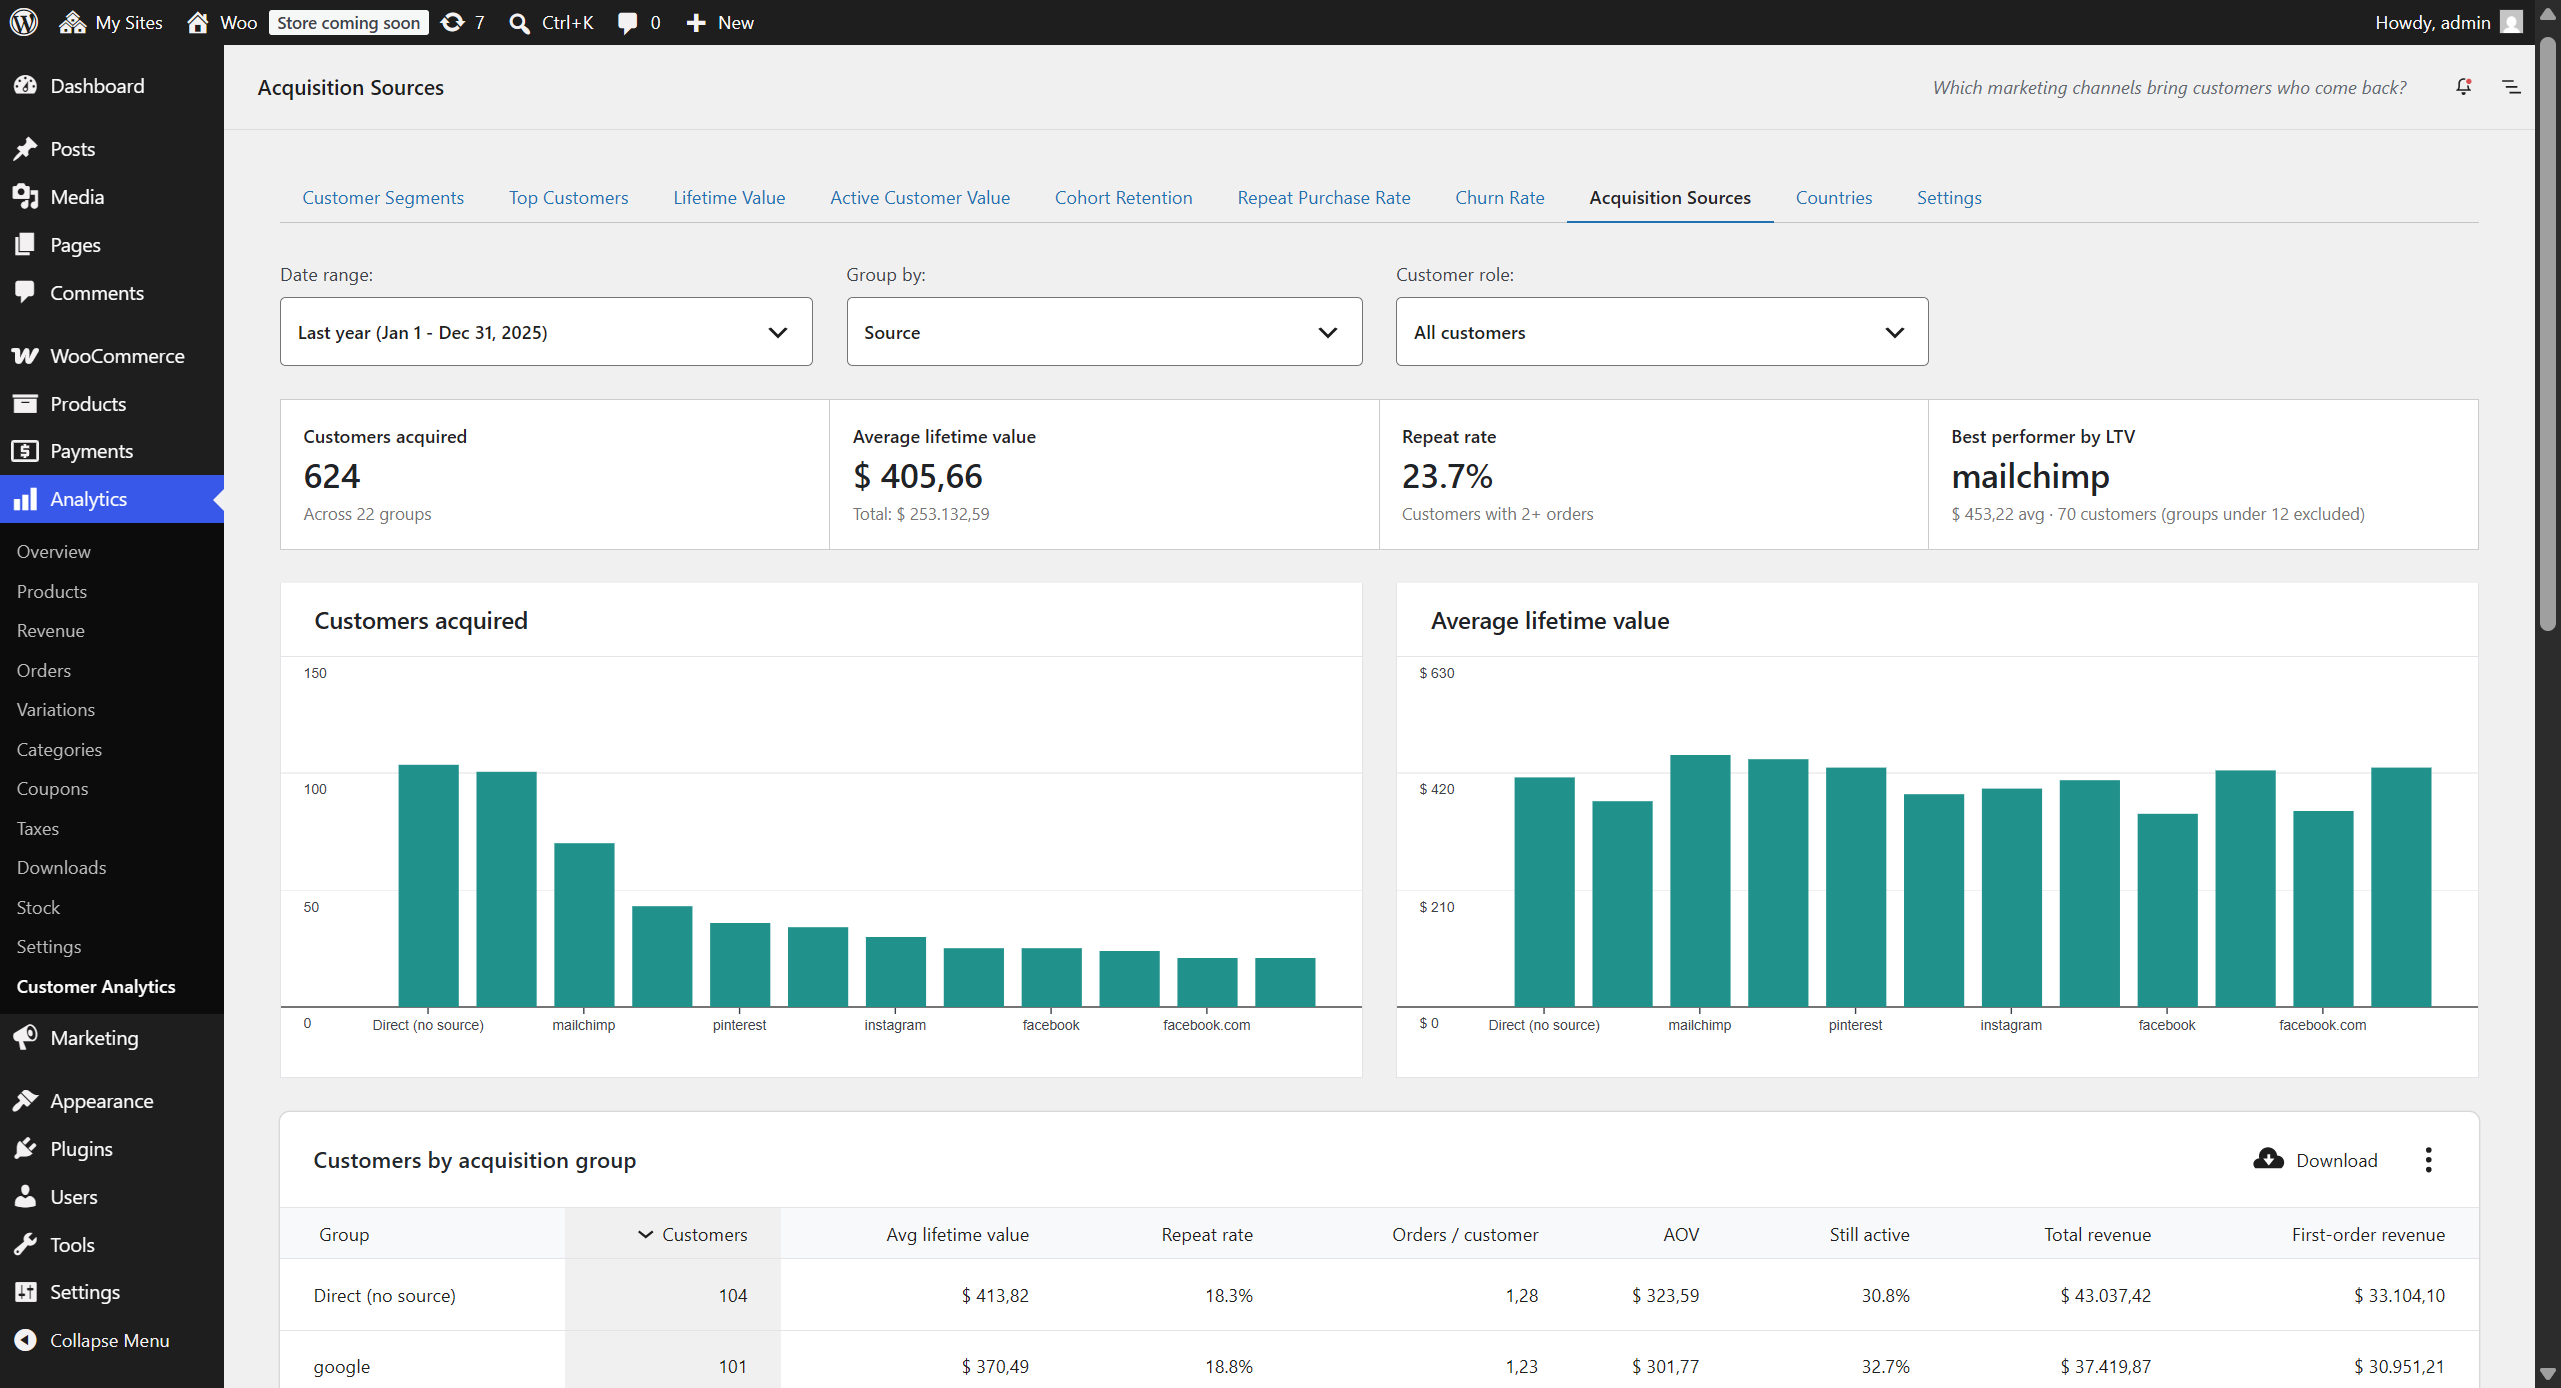
See which marketing channels bring customers who come back. Each customer is attributed to the channel of their first order — the channel that acquired them — using the order attribution data WooCommerce already records, and the report then measures what those customers went on to be worth over their whole relationship with your store.
What is displayed
- Table: One row per acquisition group, at whatever level the “Group by” picker selects, with the customers acquired, their average lifetime value, repeat rate (share with two or more orders), orders per customer, average order value, still-active share, total revenue, and first-order revenue
- Charts: Customers acquired and average lifetime value, side by side — the group with the most customers is frequently not the group with the most valuable ones. The charts show the twelve largest groups; the table lists them all
- Summary cards: Customers acquired in the range, their blended average lifetime value, the blended repeat rate, and the best performing group by average lifetime value. To keep that last card meaningful, only groups holding at least 2% of the acquired customers are considered — one big spender in a two-customer group is not a finding — so the card can name a different group than the top row of the table sorted by average lifetime value. The card states the cut-off whenever it excluded anything. On very small stores, where the cut-off would exclude every group, it is dropped and all groups are considered
Group by
- Channel (default): Campaign / UTM, Organic search, Referral, Direct, Web admin, Mobile app, Point of Sale, or Unknown. “Campaign / UTM” means the customer arrived through a link carrying UTM parameters — email, affiliate and paid ads all land here, so group by Medium to tell them apart
- Source, Medium, Campaign: The utm values recorded on the acquisition order, for stores that tag their campaigns. Customers with no utm value on their first order fall back to their channel label with the missing level named — “Direct (no source)” under Source, “Direct (no medium)” under Medium — so a fallback row is never mistaken for a source the store actually tagged; under Campaign they are grouped as “No campaign”
How values are measured
The date range is an acquisition window: the customers shown are those whose first order falls inside it. Every figure is then a lifetime figure for those customers, measured up to the end of the range — so widening the range adds customers, and moving its end forward gives the customers already included more time to buy again. “Still active” means the customer ordered within the saved Churn period counted back from the range end.
Important notes
- Attribution is taken from the first order only. A customer acquired through a paid campaign stays in that source even if they later arrive directly
- WooCommerce records the source of an order only while its Order Attribution feature is active, so older orders carry none and those customers are grouped as “Unknown”. The report shows the share of customers that have attribution data and displays a notice when it is low
- This is a money report: refunds are subtracted from revenue, matching WooCommerce, while order counts and dates stay over real orders
- Guest orders are grouped by billing email address
- WooCommerce’s own Order Attribution report counts orders by their own source; this report counts customers by the source that acquired them, so the two are not expected to match row for row
Filters
- Date range selection (picks which customers were acquired)
- Group by: Channel, Source, Medium, or Campaign
- Customer role: segment the report by WordPress user role, or select Guests for orders placed without an account
- Product category: narrow the report to the customers who bought from one or more product categories, matching those who ever purchased from them, only ever purchased from them, or first purchased from them, and requiring any or all of the selected categories; this selects which customers are reported, not which sales are counted
- Currency: on stores that have taken orders in more than one currency, report on a single currency, or on all of them converted to your store currency at the rates set in the settings; a single currency covers that currency’s orders alone, so counts and dates follow them too
Data Export: CSV download of the full source breakdown
10. Countries
↑ Back to topWhich countries bring the most sales, and which produce customers who come back?
Location: WooCommerce → Analytics → Customer Analytics → Countries tab
Treat each market as a group of customers rather than a pile of orders. Every country row carries the usual sales figures alongside how many customers that market holds, what they are worth over their lifetime, how many buy again, and how many are still active.
Metrics displayed
- Items sold: Product quantity by country
- Net sales: Net product revenue (gross sales minus coupons) with refunds subtracted, matching WooCommerce
Analytics → Products,Analytics → Categories, andAnalytics → Revenuemethodology - Products: Distinct products purchased in that country over the selected period
- Orders: Total order count per country
- Customers: Customers with at least one order in the selected period, each counted under a single country so the country counts add up to the period total
- Average lifetime value: Average lifetime spend of that country’s customers, measured over their whole order history up to the end of the selected period, on the same net-of-refunds basis as the Lifetime Value report
- Repeat rate: Share of that country’s customers with two or more orders in their lifetime, matching the repeat rate in the Acquisition Sources report
- Still active: Share of that country’s customers whose most recent order falls within your configured churn period, counted back from the end of the selected date range
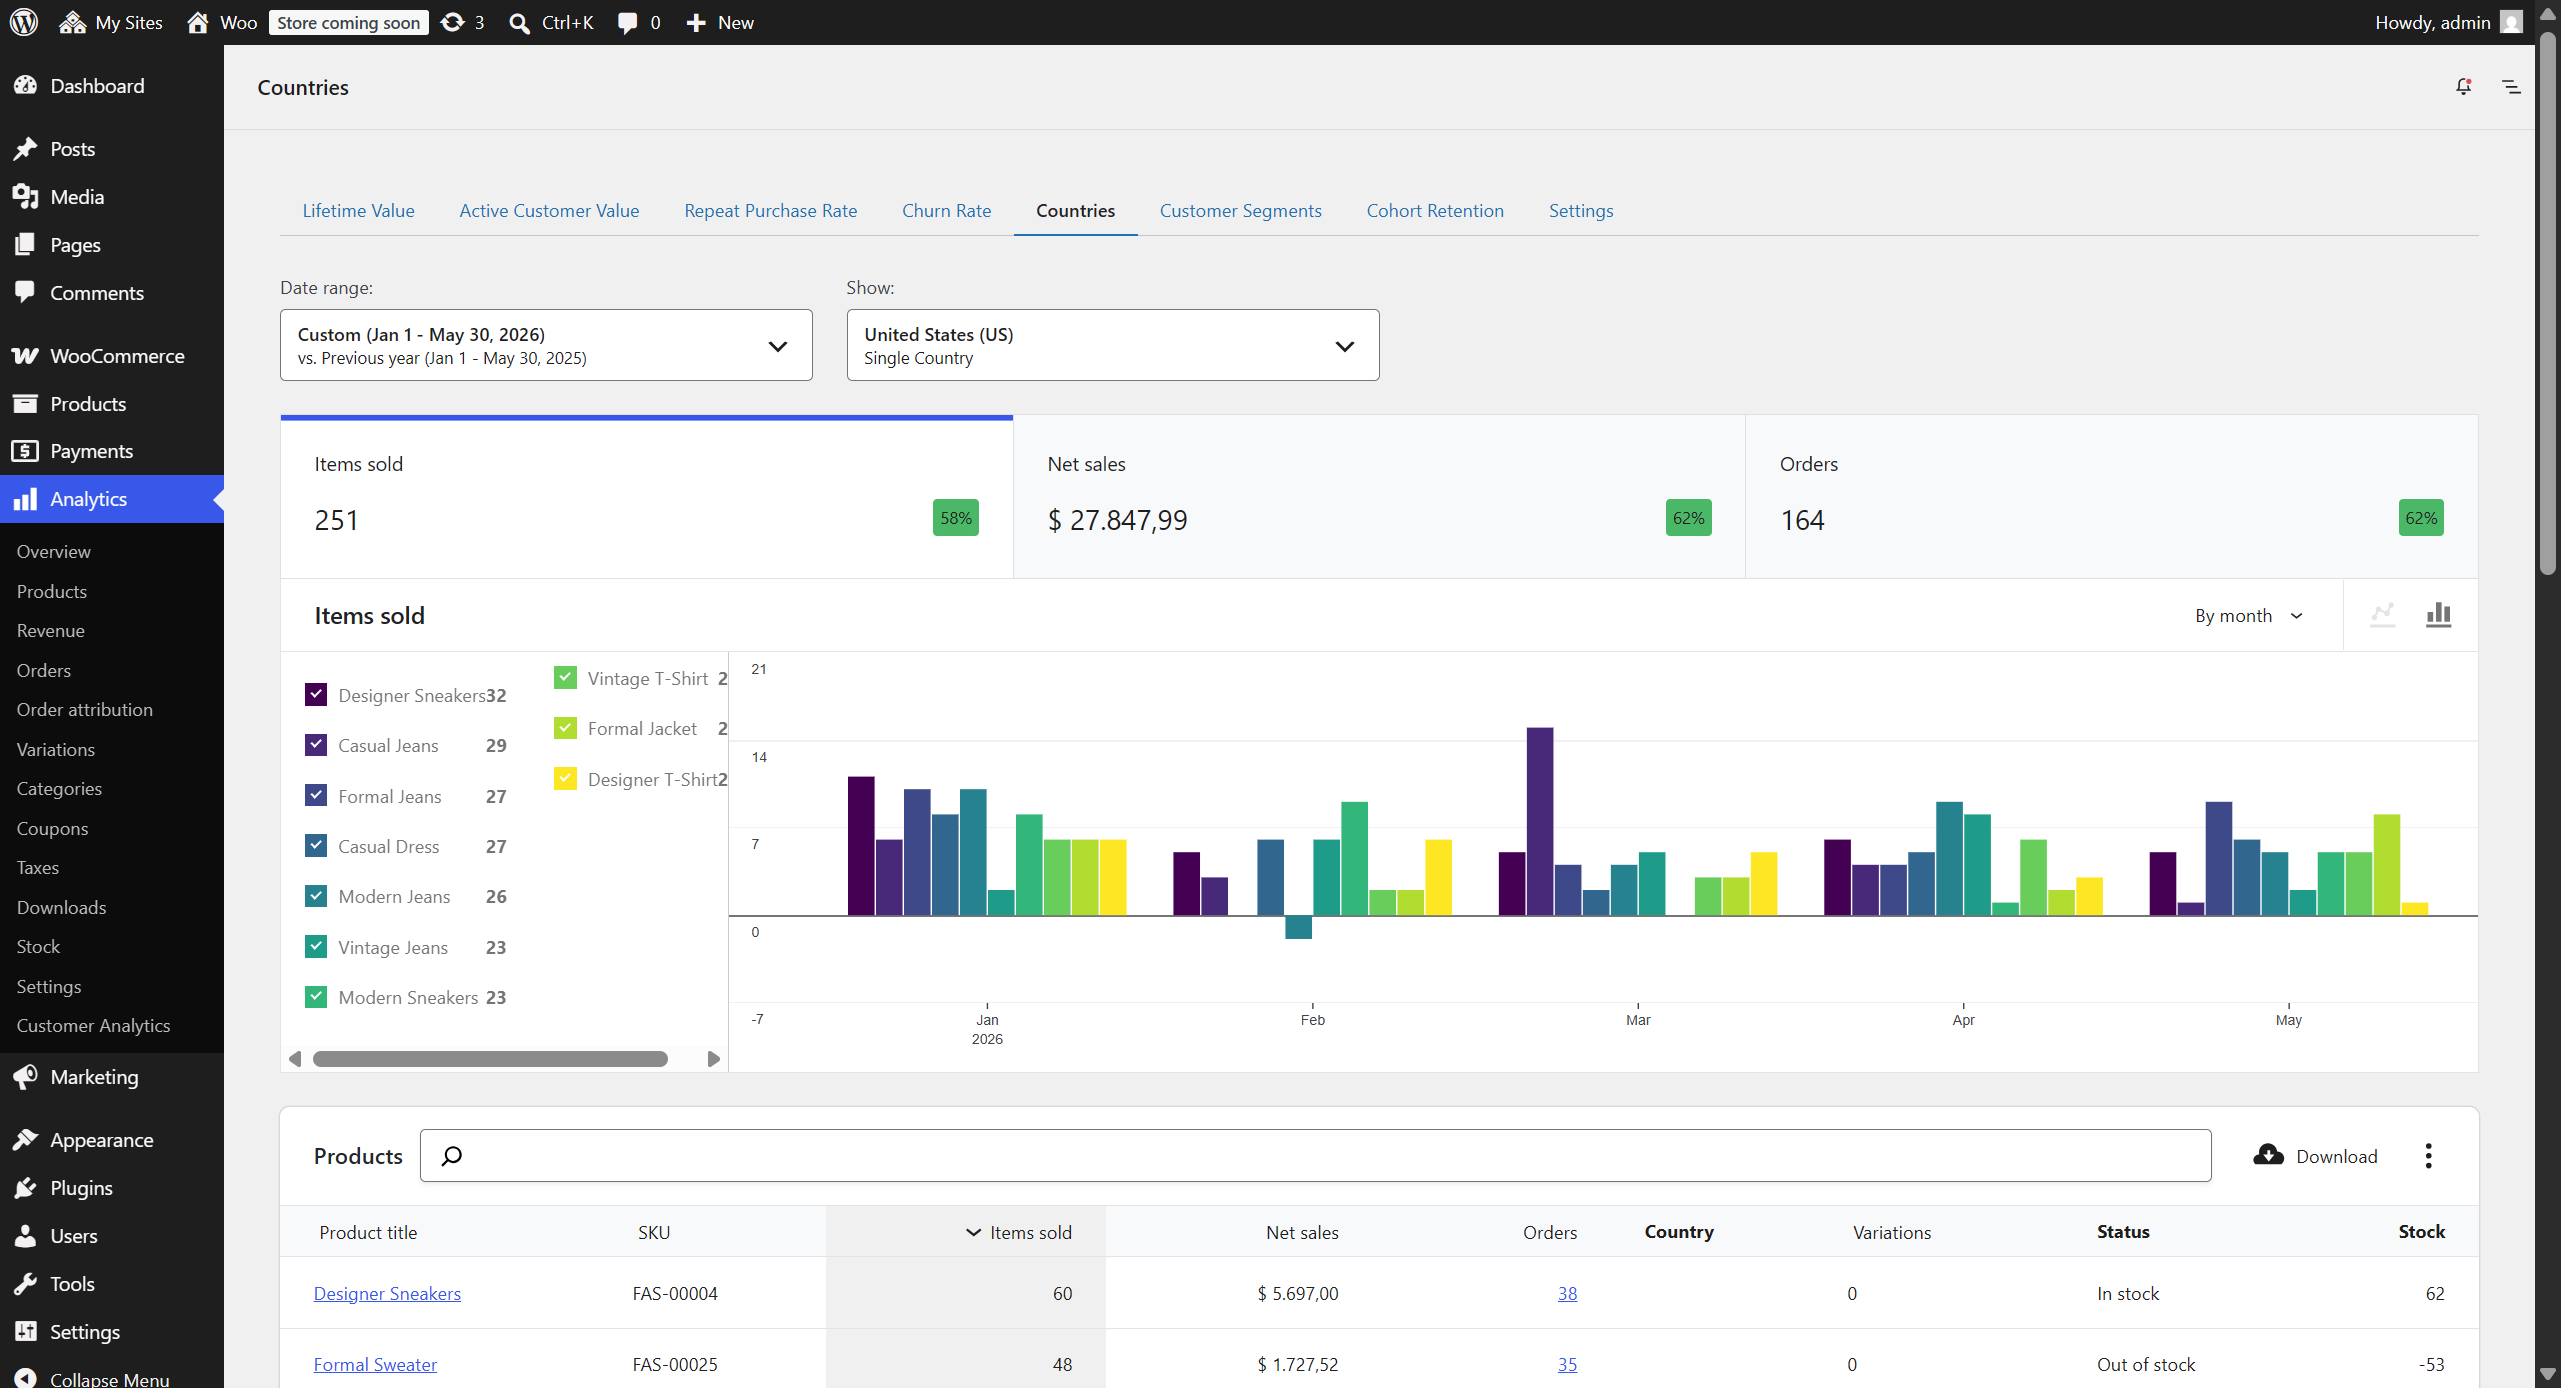
In the single country view these four measures are shown per product, over the people who bought that product in that country. The values stay whole-store lifetime figures for those buyers, so a high average lifetime value on a row means that product attracts good customers, not that they spent that much on the product itself. A customer who bought three products is counted on all three rows, which is why the rows do not add up to the totals in the table footer: those count each of the country’s customers once.
View modes
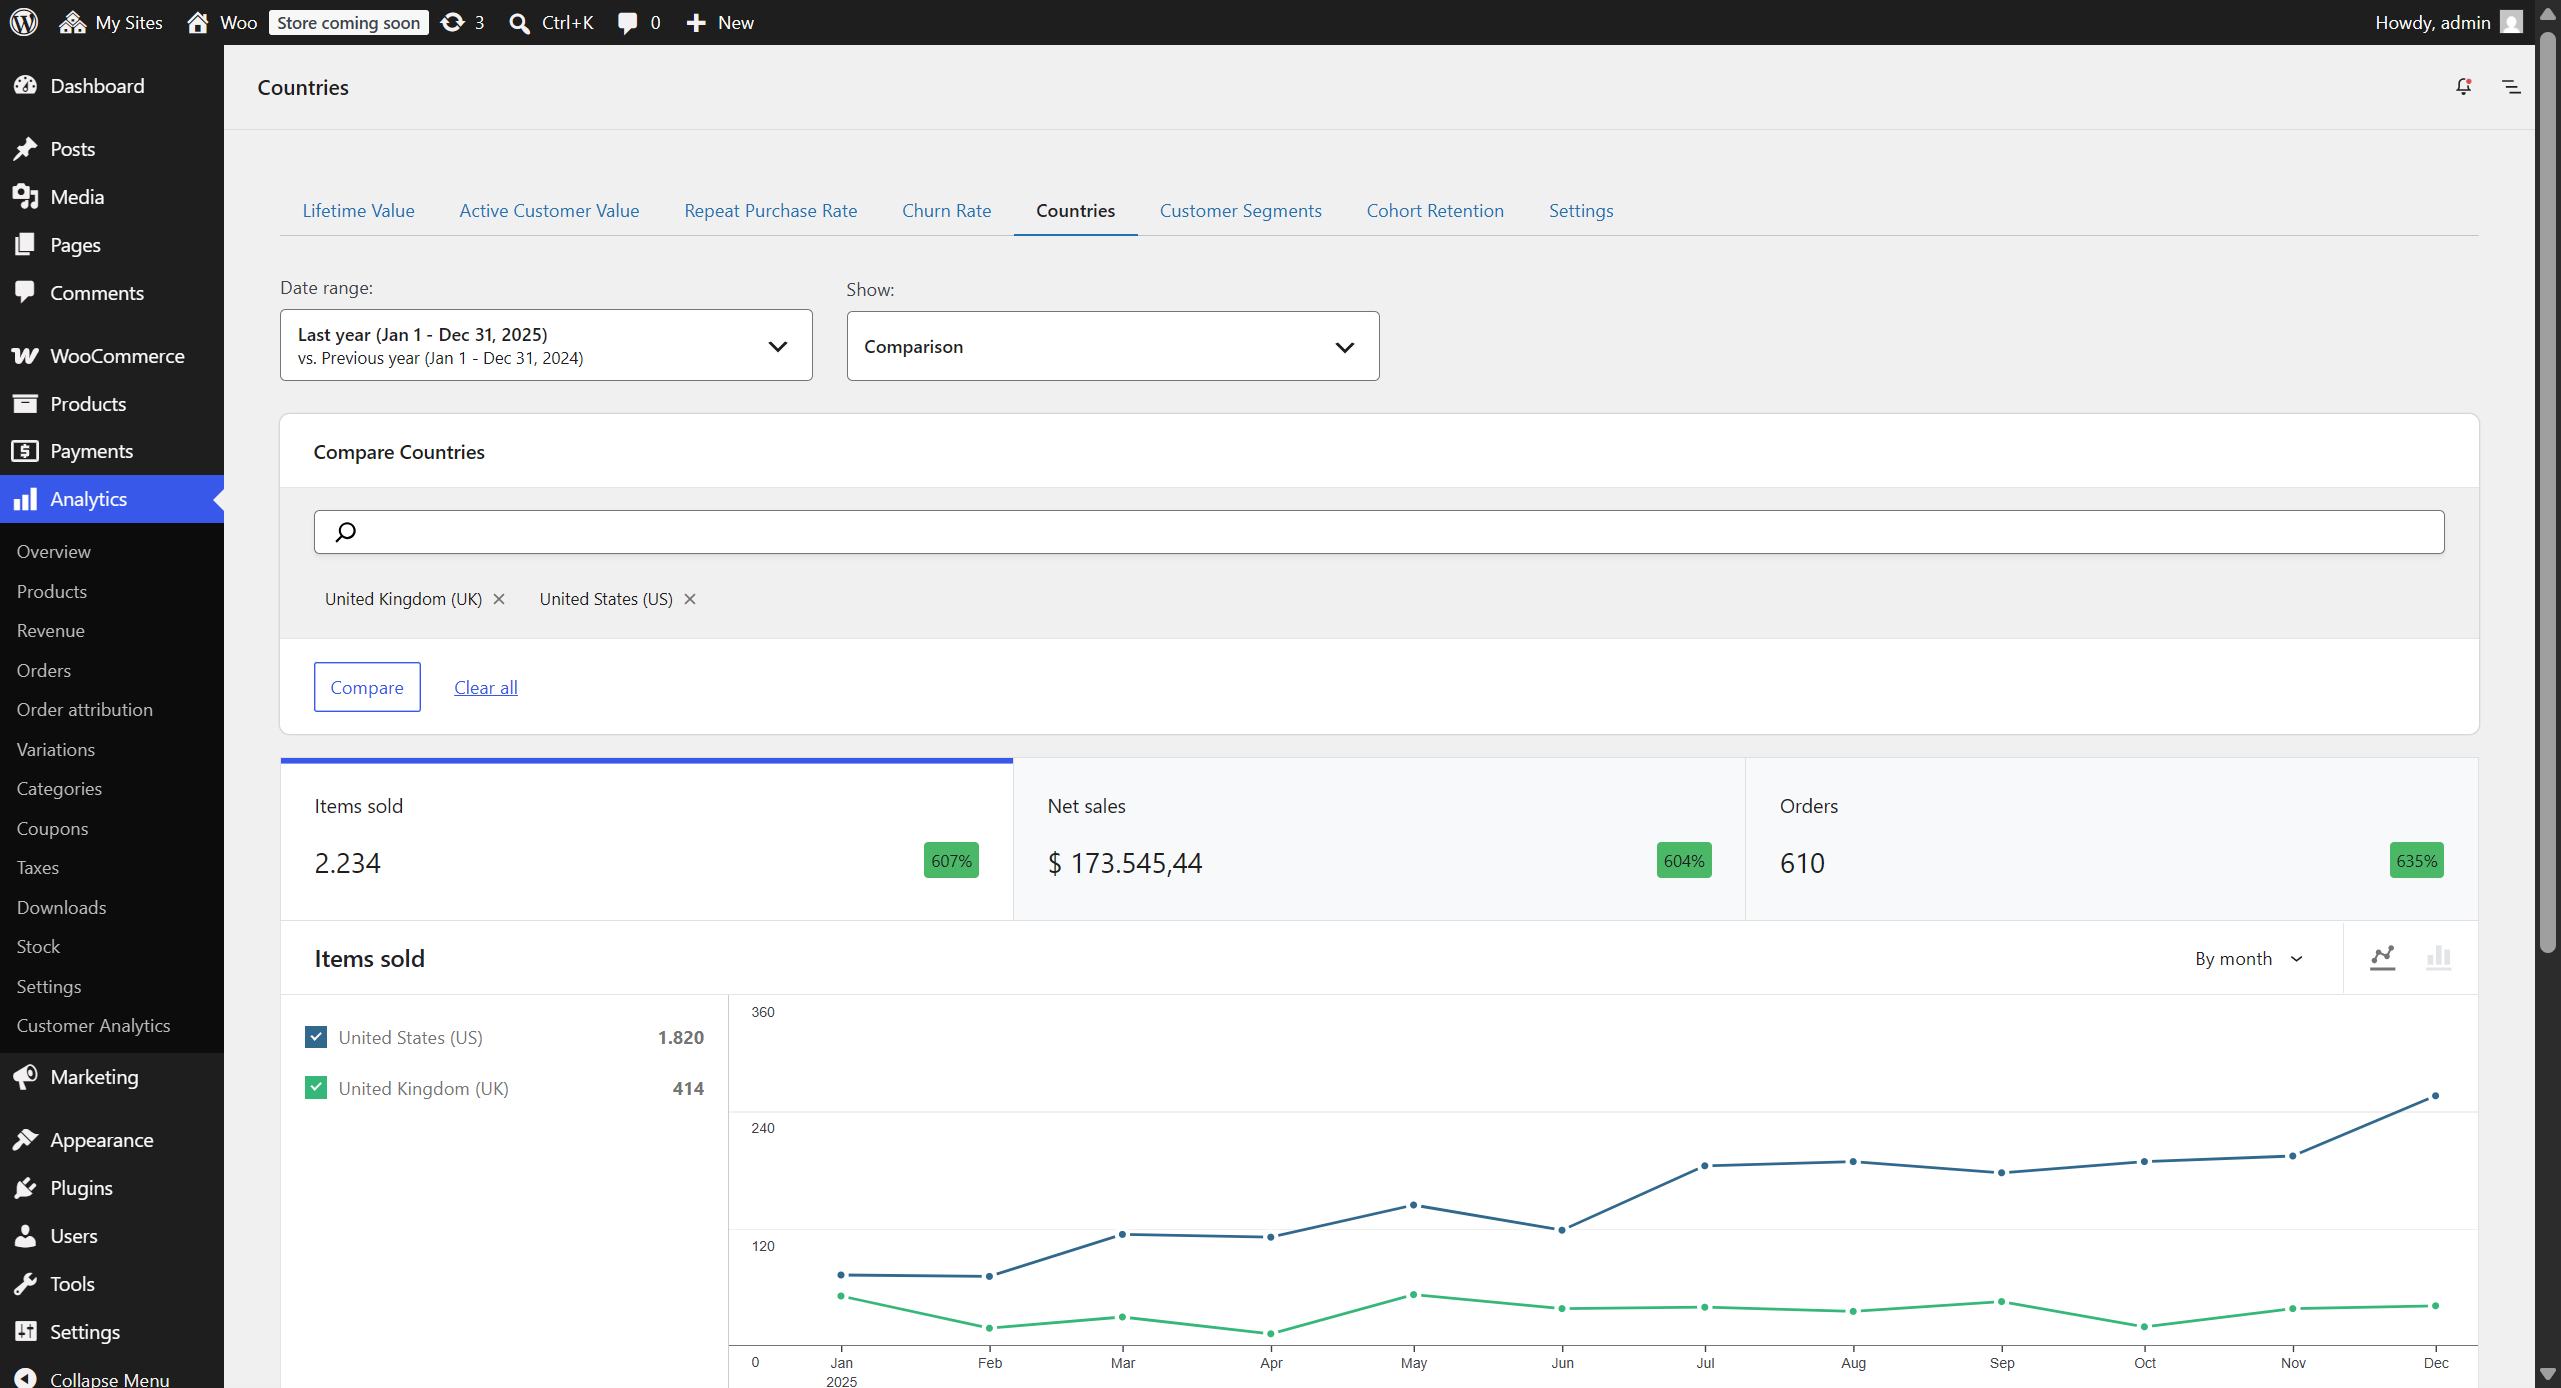
- All countries: Overview of all countries with sales, with the customer measures on every row
- Single country: Deep dive into one country, product by product. Every product it sold is listed with its sales and with the same four customer measures, computed over the customers who bought that product there
- Comparison: Compare multiple countries side-by-side, customer measures included
Advanced features
- Product segmentation for single country view: the chart plots the top 10 products by revenue, while the table below lists every product the country sold
- Customer role: segment the report by WordPress user role, or select Guests for orders placed without an account
- Product category: narrow the report to the customers who bought from one or more product categories, matching those who ever purchased from them, only ever purchased from them, or first purchased from them, and requiring any or all of the selected categories; this selects which customers are reported, not which sales are counted
- Currency: on stores that have taken orders in more than one currency, report on a single currency, or on all of them converted to your store currency at the rates set in the settings; a single currency covers that currency’s orders alone, so counts and dates follow them too
- Export the full country breakdown, sales and customer measures together, as CSV
Note: Country is determined by billing address, not shipping address.
Note: Sales figures and customer figures are attributed differently, because a country belongs to an order while a customer can order from more than one. Items sold, net sales and orders are counted against the billing country of each order. A customer is counted once, under the billing country of their most recent order in the selected period. A customer who ordered from two countries in the same period therefore contributes orders to both rows but is counted as a customer in one, which keeps the customer totals free of double counting.
Note: The customer measures need a customer record to attach to. Orders that carry no customer record at all still count towards items sold, net sales and orders, but belong to no customer, so the customer count can be lower than the order count implies.
Settings & configuration
↑ Back to topAccessing settings
↑ Back to topNavigate to WooCommerce → Analytics → Customer Analytics → Settings tab in your WordPress admin menu.
Available settings
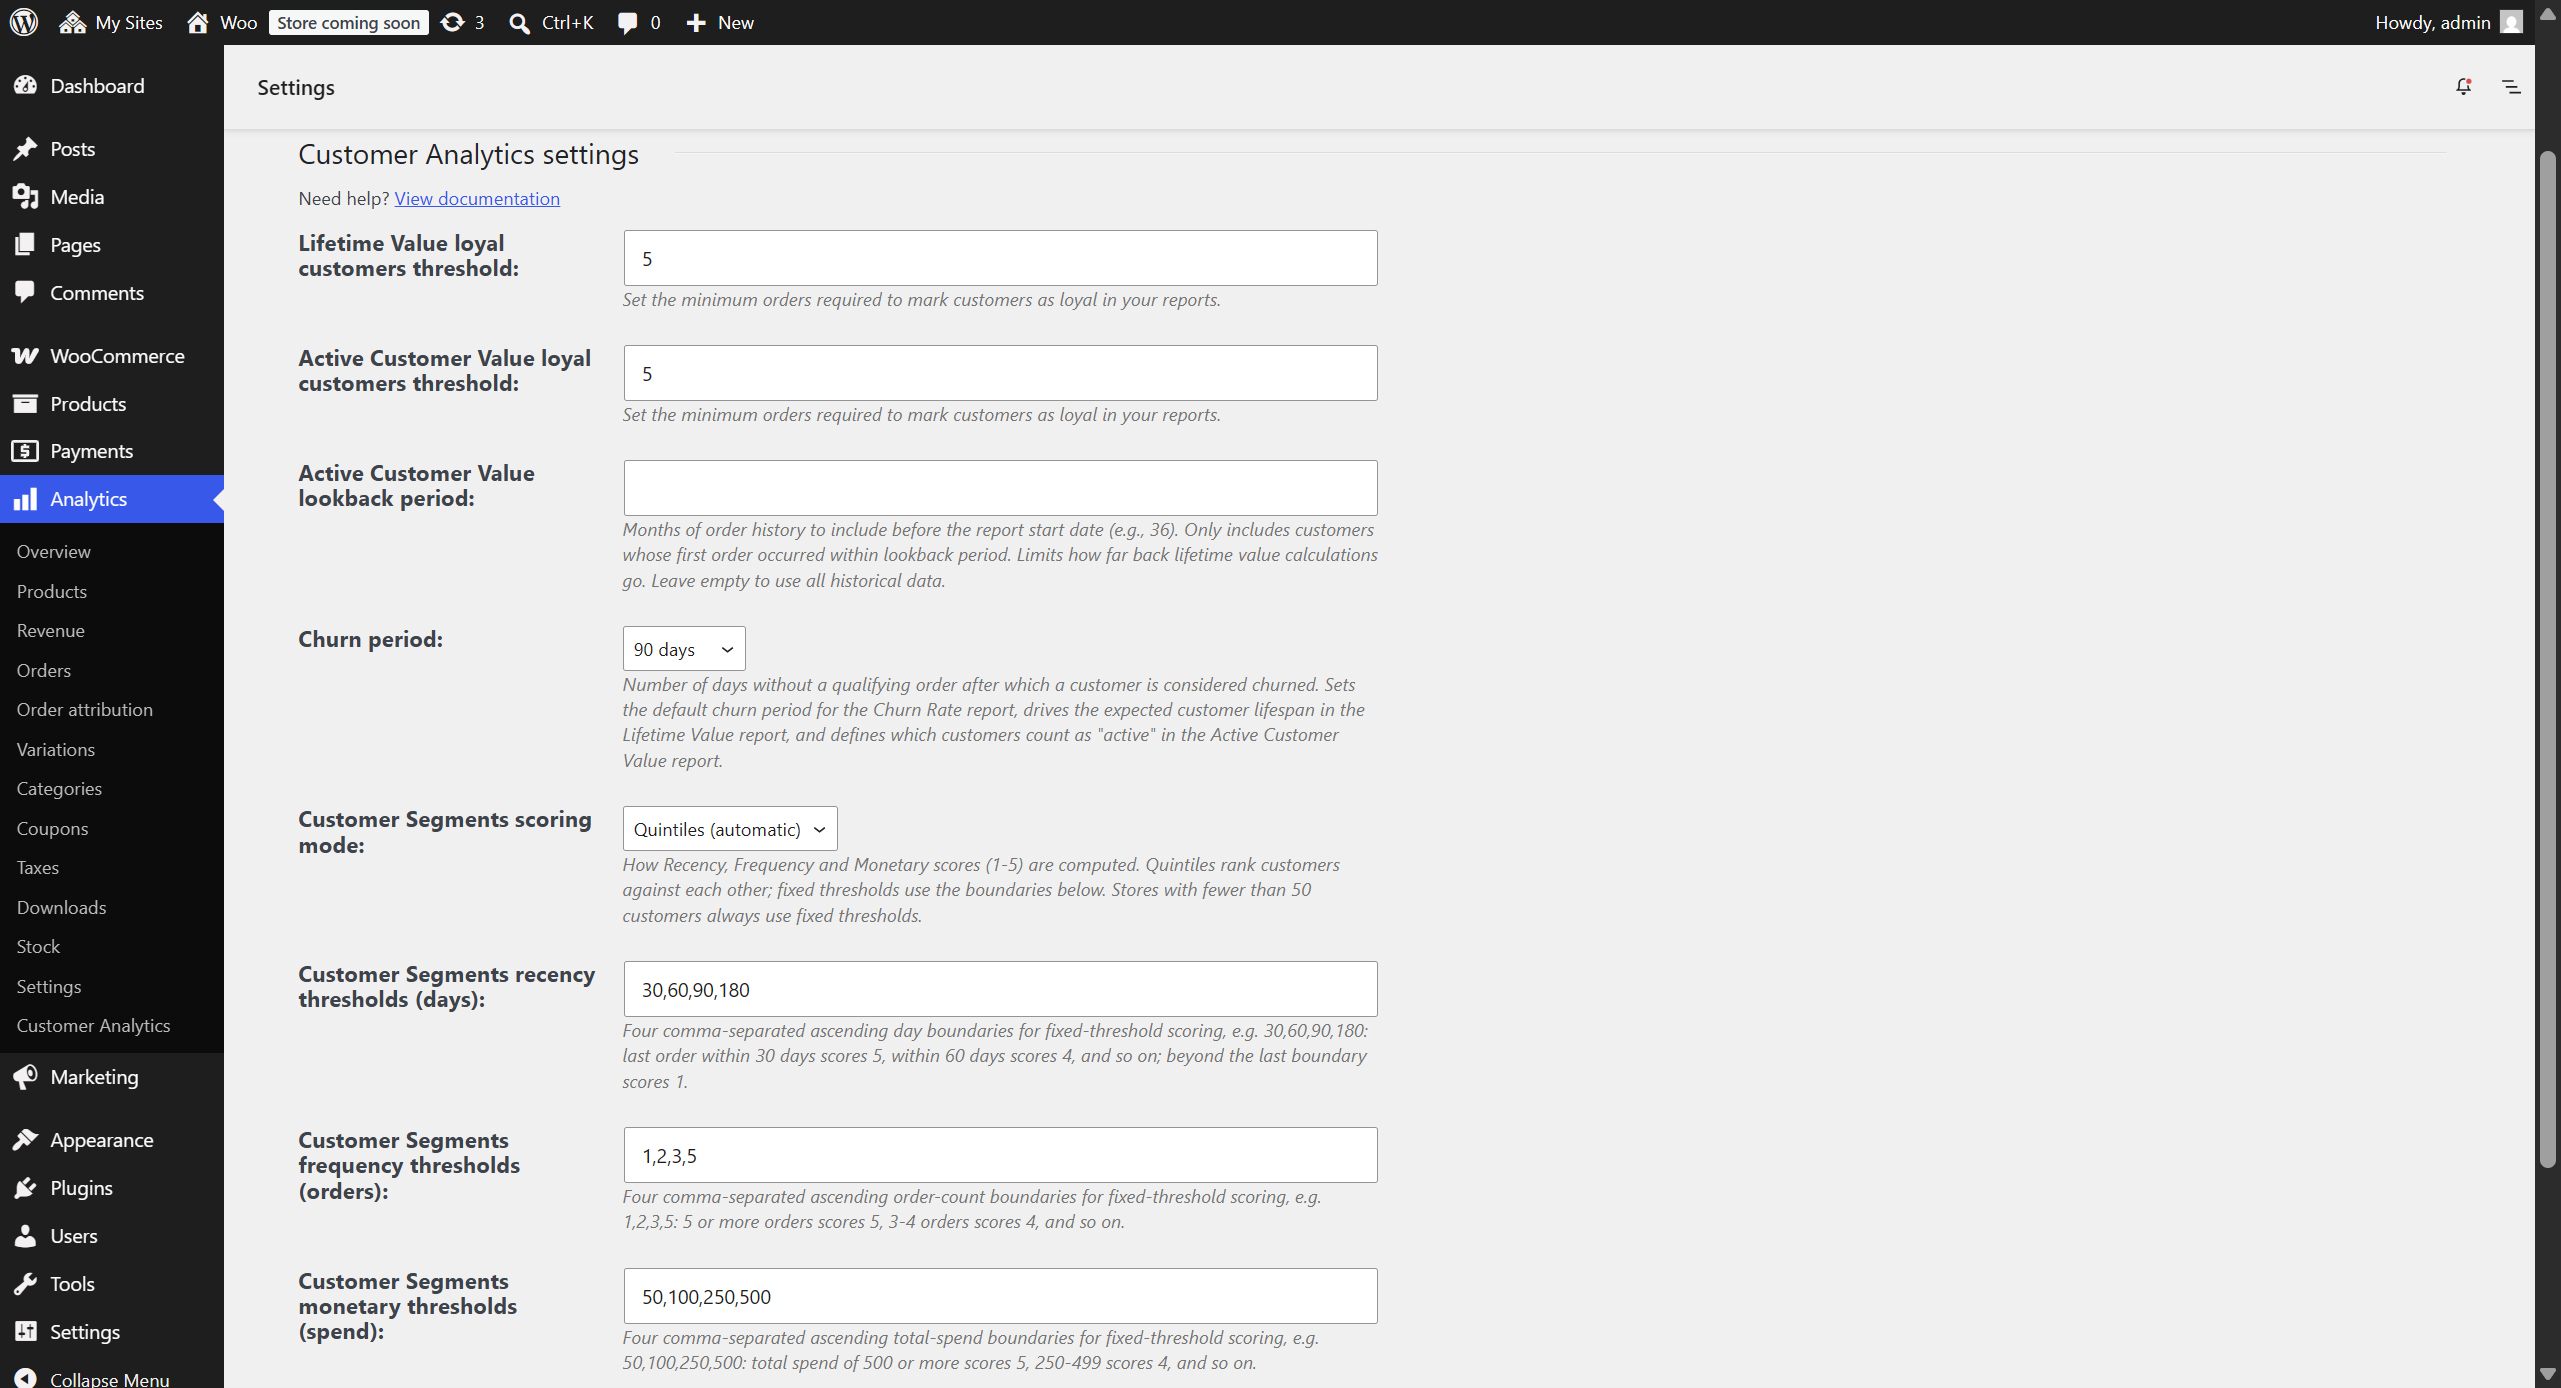
↑ Back to top1. Lifetime Value loyal customers threshold
- Purpose: Define the minimum number of orders for a customer to be considered “loyal”
- Default Value: 5
- Impact: Affects customer segmentation in Lifetime Value reports
2. Active Customer Value loyal customers threshold
- Purpose: Set loyal customer threshold specifically for trends report
- Default Value: 5
- Impact: Affects customer segmentation in Active Customer Value reports
3. Active Customer Value lookback period
- Purpose: Filters which customers to include based on when they were acquired (first purchase date)
- Default Value: Empty (includes all historical customers)
- Format: Number of months (e.g., “36” for 3 years)
- Impact: Only includes customers who made their first purchase within X months before the report start date; affects customer segment percentages by excluding customers whose first purchase was before the lookback cutoff; can improve performance by reducing data processing scope
- When to Use: When you want to analyze only recently acquired customers; when older customer cohorts had significantly different behavior patterns; for performance optimization with very large datasets
- Example: With a 12-month lookback and report date range of January 2024, only includes customers who made their first purchase after January 2023
- Note: The lookback period is calculated from the report START date, not the end date
- Period Comparisons: When comparing periods (e.g., Year to date vs. Previous year), the lookback is applied independently to each period. This means you’re comparing “recent customers from 2024” vs. “recent customers from 2023” rather than the same customer cohort across both periods
4. Churn period (days)
- Purpose: Number of days without a qualifying order after which a customer is considered churned (the inactivity threshold)
- Default Value: 90
- Impact: Sets the default churn period for the Churn Rate report, drives the Expected customer lifespan and Expected lifetime value shown in the Lifetime Value report (lifespan = 1 ÷ monthly churn), and defines which customers count as “active” in the Active Customer Value report and in the Acquisition Sources report’s “Still active” column. The Churn Rate report’s on-page “Churn period” dropdown still lets you explore other periods for that report
5. Customer Segments scoring mode
- Purpose: Choose how Recency, Frequency, and Monetary scores are calculated in the Customer Segments (RFM) report
- Options: Quintile (splits the customer base into five equal groups per dimension) or Fixed (uses the threshold boundaries below)
- Default Value: Quintile
- Note: Stores with fewer than 50 qualifying customers always use fixed thresholds, regardless of this setting
6. Customer Segments recency thresholds
- Purpose: Day boundaries that map days-since-last-order to a 1–5 recency score in Fixed mode (and in the small-store fallback)
- Default Value:
30,60,90,180(≤30 days ⇒ score 5, >180 days ⇒ score 1) - Format: Exactly four comma-separated, ascending numbers (days)
7. Customer Segments frequency thresholds
- Purpose: Order-count boundaries that map number of orders to a 1–5 frequency score in Fixed mode (and in the small-store fallback)
- Default Value:
1,2,3,5(more orders ⇒ higher score) - Format: Exactly four comma-separated, ascending numbers (orders)
8. Customer Segments monetary thresholds
- Purpose: Spend boundaries that map total spent to a 1–5 monetary score in Fixed mode (and in the small-store fallback)
- Default Value:
50,100,250,500(in your store currency; higher spend ⇒ higher score) - Format: Exactly four comma-separated, ascending numbers
9. Exchange rates
- Purpose: Converts amounts from your other currencies into your store currency, so every report can show a single combined figure. This setting appears only if your store has taken orders in more than one currency. If a currency plugin already converts your orders into your store currency before WooCommerce Analytics records them, those amounts are used as they are and the rate you enter here is not applied a second time
- Default Value: Empty, and there is no working default to fall back on. Until every currency has a rate, reports cannot offer the combined view and default to your store currency on its own, which leaves every order placed in another currency out of the figures shown
- Format: One rate per currency, entered as how much a single unit of that currency is worth in your store currency (for example 1.08 if one euro is worth 1.08 dollars)
- Impact: Adds an “All currencies” option to the Currency selector on every report, and makes it the default view. One rate is applied across your whole order history, so converted figures are an approximation rather than a historically accurate conversion
Best practices for configuration
↑ Back to top- Start with defaults: The default values work well for most stores
- Adjust based on your business: e.g., B2B stores might use higher thresholds
- Monitor performance: Use lookback periods for stores with extensive history
- Consistency: Keep thresholds aligned between related reports
Usage guide
↑ Back to topAccessing the Analytics dashboard
↑ Back to top- Main Navigation: Find “WooCommerce → Analytics → Customer Analytics” in your WordPress admin menu, which opens the Overview dashboard
- Submenu Access: Click any report from the dropdown menu
- Direct URLs: Bookmark specific reports for quick access
Navigating reports
↑ Back to topDate range selection
- Click the date picker in the top toolbar
- Choose from presets (Today, Year to date, Last month, etc.)
- Or select custom date range
- Click “Update” to refresh data
Applying filters
- For Customer Segments, click a segment card or use the “Show” dropdown to filter the table to a single segment
- For Top Customers, the date range picks which acquired customers appear; use the “Show” dropdown → Advanced filters to add a “Values as of” date that pins all values to a past snapshot (defaults to today)
- Use the “Show” dropdown to select customer segments (Lifetime Value and Active Customer Value reports)
- For Cohort Retention, the date range picks which acquisition months appear as cohort rows; retention is always tracked up to today
- For Repeat Purchase Rate, use the date range and interval grouping to set the period each rate is measured over
- For Order Sequence, the date range picks which customers were acquired; their orders are then followed forward to today. Use “Sequence depth” to choose how many order positions are resolved before the rest is pooled, and “Maturation period” to set how long an order must have aged before the step starting from it is counted
- For Churn Rate, select the churn period to define customer inactivity threshold
- For Acquisition Sources, the date range picks which customers were acquired; their lifetime values are measured up to the end of the range
- For Acquisition Sources, use the “Group by” dropdown to switch between Channel, Source, Medium and Campaign
- For Countries report, choose between All/Single/Comparison view modes
- Every report has a “Customer role” filter: segment by WordPress user role, or select Guests for orders placed without an account; the selection stays applied when you switch report tabs
- Every report also has a “Product category” filter: choose one or more categories, then choose whether to match customers who ever purchased from them, only ever purchased from them, or first purchased from them; with two or more categories selected you also choose whether customers must match any of them or all of them; selecting a category includes its subcategories, and the categories, the matching mode and the any/all choice all stay applied when you switch report tabs
- On stores that have taken orders in more than one currency, every report also has a “Currency” selector: choose a single currency to report on that currency’s orders alone, or “All currencies” to convert every amount to your store currency using the exchange rates in the settings; the selection sets the currency symbol used throughout the report and stays applied when you switch report tabs
- When your selection leaves a report covering fewer than 50 customers, the page shows a warning above the report’s summary figures with the number it covers: averages over a handful of customers still look authoritative, so the report tells you when to read them with care
- Filters automatically update charts and tables when changed
Understanding charts
- Hover for details: Mouse over data points for specific values
- Legend interaction: Click legend items to show/hide data series
Customizing reports
↑ Back to topColumn management
- Click the ellipsis menu in table headers
- Select “Columns” to show/hide specific columns
- Changes persist in your user preferences
Sorting data
- Click any column header to sort by that metric
- Click again to reverse sort order
- Default sort varies by report type
Customer profile
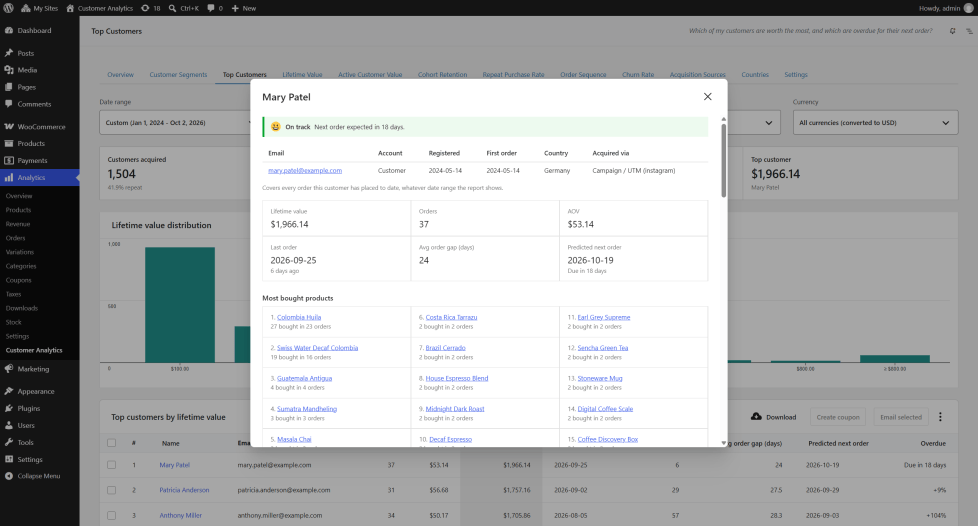
↑ Back to topClick a customer’s name in the Customer Segments or Top Customers table to open their profile in a dialog over the report. The report, its filters and your place in the table stay as they were when you close it.
What the profile shows
- Status: How the customer is doing against their own buying rhythm, at the top of the profile. New customer: one order so far, placed within your churn period. On track: their next order is not due yet. Overdue: past their predicted next order by up to one of their usual gaps between orders. Long overdue: more than one usual gap late, but still within your churn period. Lapsed: no order for longer than your churn period, and for a repeat customer also more than one usual gap late. A customer who orders once a year therefore reads as on track or overdue between purchases, not as lapsed. The status describes buying behavior, not satisfaction
- Details: Email address, whether the customer has an account (with their user roles) or ordered as a guest, the date they registered if they have an account, the billing country of their latest order, the date of their first order, and the channel that first brought them, read from the attribution data of their first order the same way the Acquisition Sources report does
- Summary figures: Lifetime value, Orders, AOV, Last order (with the days since), Avg order gap (days), and Predicted next order with how far the customer is from it
- Most bought products: Up to 15 products they have bought the most units of, ranked down three columns, with the number of orders each one appeared in. When they have bought more than 15 different products, a line underneath gives the total
- Orders: Every order, newest first, with its number (linked to the order screen), date, status, items, net total after refunds, and the days since their previous order. The list starts with the latest 50 orders, and Show more orders adds the next 50 each time it is clicked. The figures above always cover every order
- Segment: When the profile is opened from Customer Segments, the customer’s segment in that report’s date range
How values are measured
The profile always covers the customer’s whole history up to today, whatever date range or “Values as of” date the report is showing. Its lifetime value and order count therefore match the customer’s row in Top Customers when that report covers your whole order history with no “Values as of” date, and can differ from a row measured over a shorter range.
The profile follows the report’s currency selection, so it shows one currency at a time or all currencies converted, just as the report does. The customer role and product category filters choose which customers a report covers, so they have no effect on one customer’s profile.
Refunds are handled the same way as in the value reports. Each order’s net total subtracts its own refunds, and a fully refunded order is listed with the status Refunded but not counted as an order. Customers are identified by email address, so a guest checkout and a later account with the same email are one customer.
Acting on a customer
Email customer opens a new message to them in your email program. Create coupon issues a WooCommerce coupon restricted to their email address and limited to one use, with the same options as the report’s own coupon button. Edit user opens the WordPress account of a registered customer.
Exporting data
↑ Back to topCSV export
- Locate the “Download” button above any data table
- Click to generate CSV file
- File includes all visible columns and rows
- The export follows the filters on screen, and records the active customer role, product categories and currency in a comment block at the top of the file, so an export taken under a filter cannot later be mistaken for the whole store
- Use Excel, Google Sheets, or other tools for analysis
Print and PDF
The Overview dashboard has a “Print / Save as PDF” button, which uses your browser’s own print dialog. Choose “Save as PDF” there to produce a file instead of paper. The printed page leaves out the admin interface and the filters, and is headed with your store name, logo and web address, the date range, the time the figures were taken and the currency they are in, so it can be sent to someone who has no access to your store. Each page carries its number, so your browser’s own “Headers and footers” option can stay switched off and its long admin web address stays off the page. The individual reports export as CSV rather than PDF.
Data requirements for reliable analytics
↑ Back to topMinimum data
↑ Back to topYou need at least 100 customers and 3–6 months of order data for meaningful analytics.
Better results with
↑ Back to top- More customers: 300+ customers produce more accurate metrics
- More history: 12+ months of data reveals real trends
- Regular purchases: Weekly or monthly buyers generate more reliable patterns than yearly buyers
Warning signs your data may be insufficient
↑ Back to top- Metrics fluctuating wildly between intervals (30%+ changes)
- A single large customer significantly skewing the results
- Fewer than 30 customers in a given report period
- Analysis period shorter than your typical customer purchase cycle
In general: More data leads to more reliable insights.
Avoiding recency bias
↑ Back to topRecency bias occurs when recent customers appear less valuable simply because they haven’t had enough time to demonstrate their full behavior patterns, not because they’re actually worse customers.
Exclude recent data from business decisions
↑ Back to topThe exclusion period should match your typical customer purchase cycle:
| Purchase Cycle | Exclusion Period | Example |
|---|---|---|
| Weekly | 30 days | Groceries, consumables |
| Monthly | 60 days | Subscription boxes, regular services |
| Quarterly | 90 days | Seasonal products, B2B supplies |
| Bi-annual | 180 days | Fashion, electronics |
| Annual | 365 days | Insurance, enterprise software |
Best practices
↑ Back to top- Match analysis period to purchase cycle: Weekly purchase products should be analyzed over quarterly periods; monthly products over yearly periods
- Use complete periods only: Analyze full months or quarters that ended at least one purchase cycle ago, rather than partial periods
- Compare like with like: Compare January 2024 to January 2023, not an incomplete current week to a complete prior month
The Order Sequence report applies this principle for you rather than leaving it to the date range. A step into the next order is counted only once the order it starts from is older than the maturation period, so customers who have not yet had time to come back are held out instead of being counted as customers who chose not to. The period defaults to your churn setting, can be changed on the page, and the report states how many customers it is holding out.
Key principle: The more recent the data, the less reliable the metrics. When you see concerning trends in recent data, wait at least one full purchase cycle before taking action.
Data accuracy
↑ Back to top- Order Status: Only includes orders based on WooCommerce Analytics settings
- Refunded Orders: Money reports (Lifetime Value, Active Customer Value, Countries, Top Customers, Acquisition Sources, and the Customer Segments monetary value) subtract refunds, matching WooCommerce; behavioral reports (Churn Rate, Repeat Purchase Rate, Cohort Retention, Order Sequence) exclude fully refunded orders as non-purchases
- Order Position: Order Sequence numbers a customer’s orders across their whole history, counting only real orders. A fully refunded order is skipped rather than occupying a position, so it cannot shift every later order down one place
- Date Calculations: All metrics use order creation date (not completion or payment date)
- Net sales (Countries): Net product revenue (gross sales minus coupons) with refunds subtracted, matching WooCommerce’s Revenue, Products, and Categories reports
- Country Attribution: Sales figures are counted against the billing country of each order, while a customer is counted once under the billing country of their most recent order in the selected period; a customer who ordered from two countries contributes orders to both rows but is counted as a customer in only one, so customer counts never double-count
- Acquisition Attribution: The source shown for a customer is taken from their first order, using the order attribution data WooCommerce records; customers whose first order carries none are grouped as “Unknown”
- Guest Orders: Grouped by billing email for CLV calculations
- Customer Role: Selecting a role limits every figure to customers who hold that role now; guest orders have no user account and appear only under “Guests”, so role-filtered totals do not add up to the unfiltered totals
- Multiple Currencies: If your store has taken orders in more than one currency, every report gains a Currency selector. Selecting a single currency reports on that currency’s orders alone, so order counts, first and last order dates and customer groupings all follow those orders; a customer who buys in two currencies is counted under both. Choosing “All currencies” converts every amount to your store currency using the exchange rates you set, and leaves counts and dates unchanged
- Exchange Rates: Conversion uses one rate per currency, which you enter in the plugin settings and which applies to your whole order history, so converted figures are an approximation and do not reflect the rate on the day of each order. Until every currency has a rate, the converted view is not offered and reports stay scoped to a single currency
- Currency Switcher Plugins: Many currency plugins convert each order into your store currency before it reaches WooCommerce Analytics. Where that has already happened, the reports use the stored amounts as they are and your exchange rates are not applied on top, so entering a rate for such a currency changes nothing. This is checked separately for the two Analytics tables, because some plugins convert one and leave the other in the currency the customer paid in
- Mixed Currency Records: A few currency plugins convert only the orders touched by a WooCommerce Analytics historical data import, leaving later orders in the currency they were placed in. The reports warn when they find this, because no exchange rate can correct a figure that adds converted and unconverted orders together. Customer, order and retention figures are unaffected
- Product Category: Selecting a category limits every figure to the customers who bought from it, but their figures still cover their complete order history across the whole store, so revenue shown under a category filter is not that category’s revenue; a refunded order does not count as a purchase from the category, and category-filtered totals do not add up to the unfiltered totals
- Overview Dashboard: Every figure is produced by the same code as the report it links to, so the two always agree. Three figures deliberately use a window of their own rather than your date range, and say so on the page: the second order rate covers the twelve months of acquisitions ending at your range end, the cohort grid covers the six months ending there, and the best-customer list ranks your whole history with recency measured at your range end
- Overview Retention Sentence: The share of customers kept, in the plain sentence at the top of the dashboard, takes the customers who ordered in the period immediately before your date range and counts how many of them ordered again inside it. Both windows move with your date range, so it means the same thing at any range length. It is not the churn rate taken away from 100. The churn rate beside it measures a fixed inactivity window set by your Churn period, so on a range longer than that period the two answer different questions and are not meant to match
- Dashboard Freshness: The Overview dashboard is cached and states when its figures were taken, so a figure there can be older than the same figure opened in its own report. “Refresh” rebuilds it
- Customer Segments (RFM): Scored for the selected date range, with recency measured from the end of the range; Average lifetime value is the average total spent per customer within that range
Troubleshooting & FAQ
↑ Back to topCommon issues and solutions
↑ Back to topReports show no data
- Cause: No orders in the selected date range, no HPOS, WooCommerce Analytics disabled, or historical order data never imported into the WooCommerce Analytics lookup tables
- Solution 1: Expand the date range or verify that order data exists. You may be viewing CLV data for repeat customers within a period that contains only repeat purchases (see Important Notes in the Lifetime Value section)
- Solution 2: Check that HPOS is enabled (see Step-by-Step Installation section), then open WooCommerce’s own Analytics reports (Revenue or Orders) for the same date range. If those are empty as well, the store’s WooCommerce Analytics data is missing rather than the plugin failing: go to WooCommerce → Analytics → Settings and run “Import historical data”
- Solution 3: If the Acquisition Sources report puts every customer in a single “Unknown” row, those customers’ first orders carry no attribution data. Orders placed before WooCommerce’s Order Attribution feature was active never recorded a source. The notice on the report states what share of customers have attribution data
Slow report loading
- Cause: Large dataset without lookback period
- Solution: Set the Active Customer Value lookback period in settings
Incorrect currency display
- Cause: WooCommerce currency settings, or a store selling in more than one currency
- Solution 1: Verify currency in WooCommerce → Settings → General
- Solution 2: If your store takes orders in several currencies, use the Currency selector at the top of the report. Amounts are shown in whichever currency it names, and “All currencies” converts them to your store currency using the exchange rates in the plugin settings
Missing Customer Analytics menu
- Cause: Insufficient user permissions
- Solution: Ensure user has
manage_woocommercecapability - Cause: WooCommerce Analytics feature is disabled
- Solution: Enable it at WooCommerce → Settings → Advanced → Features → Analytics, then reload the page
Chart not displaying
- Cause: JavaScript error or conflict
- Solution: Check browser console, disable conflicting plugins
Error message: “There was an error getting your stats. Please try again.”
- Cause: The error occurs when there’s a problem with your current session
- Solution: Refresh the page and re-authenticate with WordPress if prompted
Frequently asked questions
↑ Back to topWhat does the Overview dashboard show?
It is the screen Customer Analytics opens on, and it answers how your customer base is doing and what changed this period. Six headline figures sit at the top, each with its movement against the previous period and each linking to a different report: active customers with the share of your list still buying, new customers, average lifetime value, repeat purchase rate, second order rate and churn rate. Below them, “Worth a look” lists up to five changes that crossed a threshold this period, followed by your RFM segments, your five best customers by lifetime value, new versus returning revenue, the last six acquisition cohorts, the channels your customers arrived through and your top markets. Every section links to the report behind it, carrying your date range and your role, category and currency selections with it. The whole screen prints, or saves as a PDF, with a header naming your store and a “Sections” button for leaving out the parts a particular reader does not need.
Can I export the Overview dashboard as a PDF?
Yes. “Print / Save as PDF” opens your browser’s print dialog. Choose “Save as PDF” there and you have the file. The printed page is built for someone outside your store: the admin interface, filters and links are dropped, and it is headed with your store name, logo and web address, the date range, the time the figures were taken and the currency they are in, with a small credit line at the foot. Nothing is installed and nothing is sent anywhere, because your browser does the work. The individual reports export as CSV rather than PDF.
Why do two figures on the dashboard ignore my date range?
The second order rate and the cohort grid use fixed windows, and both say so on screen. A first-time buyer only counts towards the second order rate once their first order is old enough that not having returned means something, which is your churn period; on a one-month range almost nobody has reached that point, so the figure would be blank nearly every time you opened the page. It therefore covers the twelve months of acquisitions ending at your range end. The cohort grid needs several rows before a retention pattern is visible at all, and a one-month range holds a single cohort, so it always shows the six months ending at your range end.
Can I customize the customer segment thresholds?
Yes, through WooCommerce → Analytics → Customer Analytics → Settings tab, you can adjust loyal customer thresholds, as well as the scoring mode and threshold boundaries for the Customer Segments (RFM) report.
How are RFM segments calculated?
Each customer is scored 1–5 on Recency (how recently they ordered, relative to the end of the selected date range), Frequency (number of orders), and Monetary value (total spent). By default these scores use quintiles (five equal groups), or you can configure fixed thresholds in Settings. The combined scores map each customer to one of six segments: Champions, Loyal, At Risk, About to Sleep, Hibernating, and Lost. Stores with fewer than 50 qualifying customers automatically use fixed thresholds.
How is the predicted next order date calculated?
From each customer’s own buying rhythm: their average order gap is the time from their first to their last order divided by the number of gaps between orders, and the predicted next order is one average gap after their last order. The Overdue column shows how far past that prediction they are as a percentage of their own gap. The prediction requires at least two orders and an average gap of at least a day; customers without a usable cadence show a dash. These columns appear in both the Customer Segments and Top Customers reports.
What does the Acquisition Sources report show?
It shows which marketing channels bring customers who come back. Each customer is attributed to the channel of their first order (the channel that acquired them), and the report then reports that group’s lifetime value, repeat rate, orders per customer, average order value, still-active share, and first-order revenue against lifetime revenue. You can group the rows by channel (Campaign / UTM, Organic search, Referral, Direct and so on) or by utm source, medium, or campaign. WooCommerce’s own attribution report is order-level and answers which channel made a sale; this one answers what the customers that channel brought turned out to be worth.
Why are some customers grouped as “Unknown” in Acquisition Sources?
Because their first order carries no attribution data. WooCommerce records the source of an order only while its Order Attribution feature is active, so orders placed before that, including older order history, have none. When only a small share of the customers in range carry attribution data, the report displays a notice stating that share, so an “Unknown” row is never mistaken for a fault.
Can I create a marketing coupon for a customer segment or a group of customers?
Yes, for a whole segment or for individual customers. In the Customer Segments report, select a segment and click “Create coupon” to generate a WooCommerce coupon restricted to that segment’s customer emails (limited to one use per customer), or tick individual rows first and issue the coupon to just those customers. The Top Customers report offers the same thing for the customers you tick there, which is how you reward your highest-value customers as a group. It’s a quick way to launch win-back or loyalty campaigns. Note that the coupon matches the email used at checkout and is a snapshot taken at the time it is created.
Can I email a group of customers from a report?
Yes. The Customer Segments and Top Customers reports have a checkbox on each customer row. Select the customers you want, click Email selected, and choose Open in email client to start a message with their addresses in the BCC field, so the recipients cannot see each other, or Copy addresses to paste the list into a mailing tool. A selection carries across pages, and it is cleared when you change the date range or a filter. Because a link can only carry so many addresses, the handover to an email client is limited to 200 recipients, and copying has no limit. This is meant for reaching a small group directly. For a larger send, use the CSV export.
Does this work with subscription products?
Subscription orders from WooCommerce Subscriptions are included in the calculations like regular orders.
What determines a “churned” customer?
Within any period, a customer is counted as churned if they were active at the start of the period (they had placed an order within your configured churn period, default 90 days) but had no qualifying order by the period’s end, meaning they crossed the inactivity threshold during that period.
How often is data updated?
Reports use current data from your WooCommerce database.
Can multiple users access reports simultaneously?
Yes, multiple users can view reports at the same time.
Can I filter reports by customer role?
Yes. Every report has a “Customer role” filter, so you can compare wholesale, retail or any other role across lifetime value, retention, churn and the rest. Select Guests to see orders placed without an account. The selection stays applied as you move between reports, and the CSV export follows it. Roles are read as they stand today, since WordPress keeps no record of past role changes, so a customer moved to a different role appears under their new role for their whole order history.
Can I filter reports by product category?
Yes. Every report has a “Product category” filter with three ways to match customers: those who ever purchased from the category, those who only ever purchased from it, and those whose first purchase came from it. You can pick several categories at once and choose whether customers have to match any of them or all of them, so you can isolate the crossover buyers who have bought from every category you picked. This filter selects which customers are reported, not which sales are counted, so a customer matched on Coffee still brings their complete order history across the whole store with them. That is what lets you ask whether coffee buyers are worth more over time than everyone else, or whether the people who only ever buy coffee ever cross over into the rest of your catalog. Selecting a category always includes its subcategories, the selection stays applied as you move between reports, and the CSV export records both the categories and the matching mode.
Can I report on a store that sells in more than one currency?
Yes. If your store has taken orders in more than one currency, every report gains a “Currency” selector. Without it, amounts in different currencies are added together and labelled with your store currency, which distorts lifetime value and average order value and puts the Top Customers and Customer Segments rankings in the wrong order. Choosing a single currency reports on that currency’s orders and nothing else, so order counts, first and last order dates and customer groupings follow those orders as well; a customer who buys from you in two currencies is counted under both, so the per-currency customer counts add up to more than your total customer count. Enter an exchange rate for each currency in the settings and you also get an “All currencies” option, which excludes no orders and converts only the amounts. The selection sets the currency symbol used throughout, follows you between reports, and is recorded in the CSV export. Stores selling in a single currency see no selector and no change.
How accurate is the currency conversion?
Conversion uses one exchange rate per currency, which you enter in the settings and which is applied across your whole order history. That makes converted figures a sound approximation for comparing markets and tracking trends, rather than an exact reconstruction of what each order was worth on the day it was placed. When you need exact amounts, report on one currency at a time instead, which uses no rates at all. Until every currency has a rate, the “All currencies” option is not offered and reports stay on a single currency, so an unfinished rate table can never quietly add currencies together at par.
Known limitations
↑ Back to top- Maximum 100 items per page in data tables
- The Overview dashboard summarizes each report rather than reproducing it: the best-customer, channel and market sections show the largest five, and the cohort grid covers six months by six months. The full picture is in the report each section links to
- The Overview dashboard has no CSV export of its own, and no report other than the Overview has a print or PDF view
- Printing depends on your browser. Chrome, Edge and Firefox all offer “Save as PDF” as a print destination, and Safari offers the same through the “PDF” button in its print dialog. If background graphics are turned off in the print dialog the cohort grid loses its shading, which is why every cell also carries its percentage as text. The page numbers printed in the margin need a current browser: Chrome, Edge and Safari print them, Firefox does not
- Country reports based on billing country (not shipping)
- Guest customer grouping relies on billing email accuracy
- Customer Segments (RFM) are computed for the selected date range (recency is measured from the end of the range), not all-time, so different date ranges produce different segments
- Cohort Retention shows at most the 36 most recent monthly cohorts and 24 month offsets (M+0 through M+24); an on-screen notice indicates when a longer range is truncated
- Predicted next order and Overdue require at least two real orders and an average order gap of at least one day; customers without a usable cadence show a dash
- Order Sequence continuation rates drift up slightly on older date ranges, because a cohort acquired three years ago has had longer to come back than one acquired four months ago. The maturation period removes customers who cannot be measured at all; it does not equalise the time available to those who can
- Order Sequence applies one maturation period to every step, although the wait before a second order is usually far longer than the wait before a fifth. Deriving a separate window per step from that step’s own timings would make each figure depend on itself
- Acquisition Sources can only attribute orders that carry WooCommerce’s order attribution data, which is recorded from the moment that feature is active. Customers whose first order predates it are grouped as “Unknown”, and the report says so when only a small share of the customers in range carry it
- Acquisition Sources attributes each customer by their first order only; a customer acquired through one channel stays in that channel even if they later arrive through another
- The Acquisition Sources charts plot the twelve largest groups so the bars stay readable; the table below them lists every group
- Coupons match the email entered at checkout (billing email). A customer who checks out with a different email than the one on their order history will not match
- Coupons are a point-in-time snapshot taken at creation, so they do not update as customers move between segments or in and out of a report
- A coupon issued to a whole segment includes at most 5,000 emails (the top customers by total spent). A coupon for customers you ticked yourself is never near that limit
- The customers you tick are matched against the report when the coupon is created, so anyone who has since dropped out of it is left off and the confirmation says how many were included
- Creating a coupon requires coupon-publishing capability (Shop Manager or Administrator)
- Handing selected customers to an email client through the Email selected button is limited to 200 recipients, because a link cannot reliably carry more, and it needs an email program set up to handle those links on the computer you are using. Copying the addresses has neither limitation
- The customer role filter reads each customer’s current WordPress role. WordPress keeps no record of past role changes, so a customer moved to a different role is shown under their new role for all of their past orders
- The product category filter reads each product’s categories as they stand today, so re-filing a product changes which customers match it for all of their past orders. One matching mode applies to the whole selection, so mixed expressions such as “bought from A or B, and also from C” are not supported
- Currency conversion uses one exchange rate per currency across your whole order history, so converted amounts do not reflect the rate on the day of each order. WooCommerce records no historical rate for an order, so there is nothing to read one from. Reporting on a single currency needs no rates and is exact, but because it covers that currency’s orders alone, a customer who buys in two currencies is counted under both and the per-currency figures therefore do not add up to the converted totals
Feedback
↑ Back to topWe welcome your feedback to help shape development. Please report bugs or suggest features through the support option on this product’s page in the WooCommerce Marketplace. When reporting issues, include your WooCommerce version, store size, and any error messages to help us assist you better.

