
Subscription includes
Support
Find the customers worth keeping, see which of them are drifting away, and send them a targeted coupon without leaving WooCommerce. Customer Analytics for WooCommerce is a customer analytics and retention extension that turns the order history already in your store into RFM segments, customer lifetime value, cohort retention, churn, and acquisition source reports, inside WooCommerce Admin. There is no tracking script to add and no account to create.
Customer Analytics does not stop at reporting. Find the high-value buyers who are overdue for their next order, create a WooCommerce coupon restricted to exactly those people, or email them straight from the report. Then come back to the same report to see who ordered again.
Customer Analytics for WooCommerce extends WooCommerce’s built-in Analytics with the customer side of the story, as new reports under the Analytics menu. Nothing is replaced or removed. It is built for store owners who want to understand customers, not just orders, and suits any store with repeat purchases and a few months of trading behind it, whether that is a subscription business, a wholesale operation, or a retail catalog.
Every report starts from the same question: what happened to the customers, not to the orders. RFM segmentation scores each customer on how recently they ordered, how often they buy, and how much they spend, then sorts them into named segments you can act on. Customer lifetime value tracks what an average customer is worth across their whole relationship with your store, and what that implies about the future. Cohort retention follows each month’s new customers forward to see how many keep buying. Churn rate measures how many active customers go quiet in a period, and repeat purchase rate measures how many buy more than once. Acquisition source analysis attributes each customer to the channel that first brought them, then reports what that group went on to be worth.
Google Analytics answers where your visitors came from. Customer Analytics answers which of them became customers worth keeping, and what to do about the ones who are drifting away. It works from the orders already in your WooCommerce database.
Every customer is scored and sorted into one of six segments, and each one implies a different move:
From there it is three clicks. Pick a segment, or tick the individual customers you want, then create a WooCommerce coupon restricted to exactly those people and limited to one use each. Or email the selection straight from the table, with the addresses placed in BCC so recipients cannot see each other. The Top Customers leaderboard works the same way, so an offer for your highest spenders reaches exactly them.
Click any customer’s name in either report to open their profile: every order they have placed, what they buy most, how they were first acquired, and whether they are on track, overdue, or lapsed against their own buying rhythm. Email them or create a coupon just for them from the same screen.
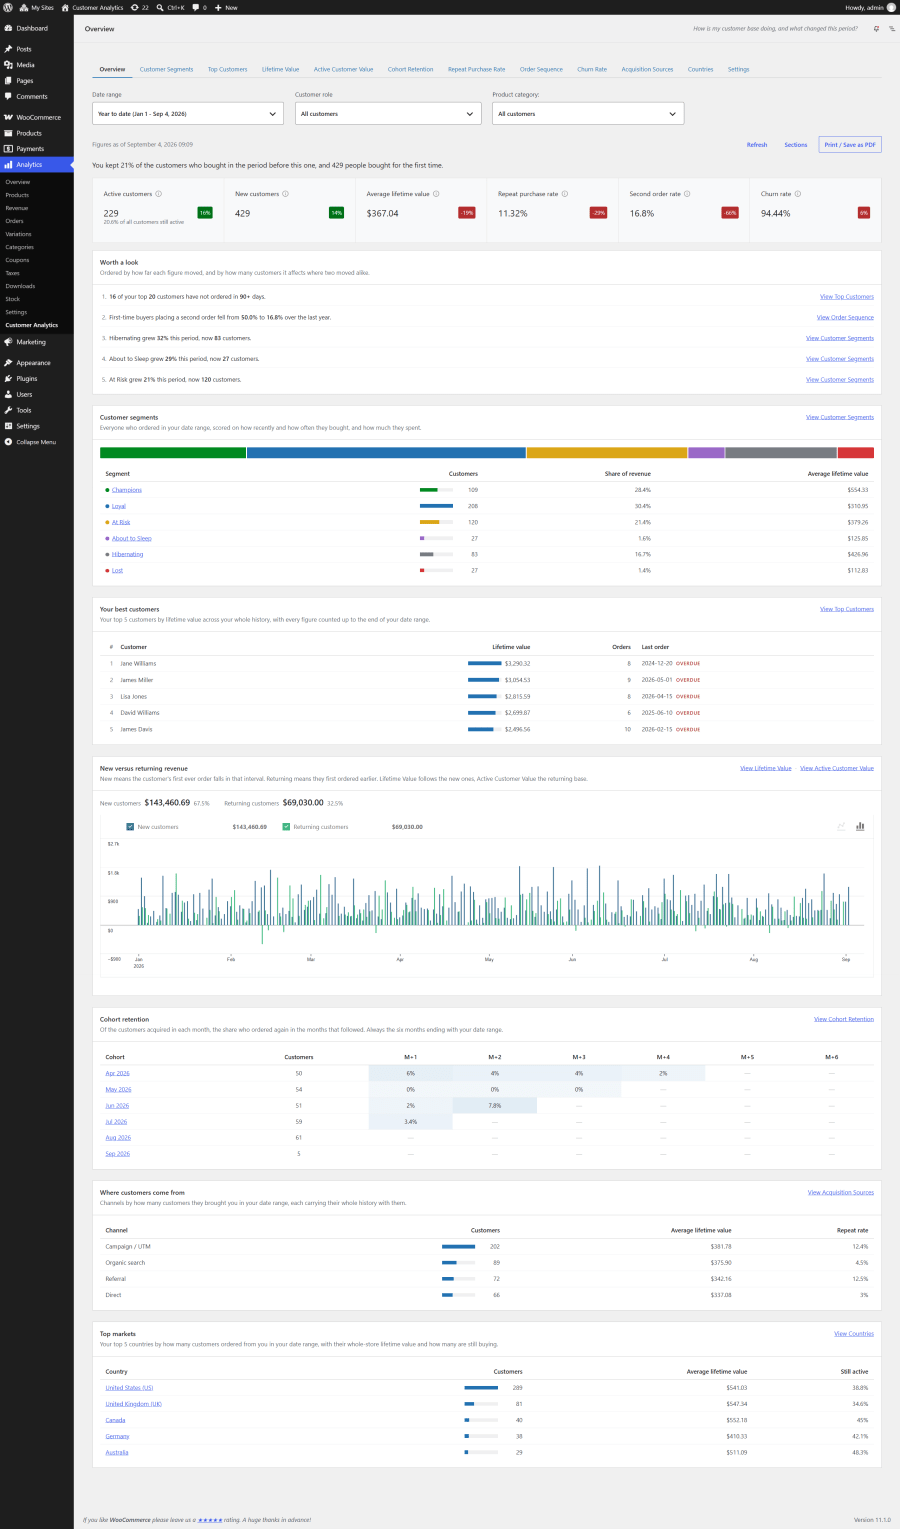
How is my customer base doing, and what changed this period?
The Overview dashboard is the screen Customer Analytics opens on. It gathers the headline figure from every report onto one page, flags which of them moved enough this period to need your attention, and links through to the report behind each one.
Key features:
Example: Open it on a Monday morning. If “Worth a look” is empty, nothing crossed a threshold and you can close the tab. If it says 14 of your top 20 customers have not ordered in 90 days, one click takes you to the list of who they are.
Who are my best customers, and who is slipping away?
The Customer Segments report groups your customers using RFM analysis (Recency, Frequency, Monetary). Every customer is scored 1 to 5 on how recently they ordered, how often they buy, and how much they spend, then mapped to one of six named segments, so you can see who your best customers are and who needs winning back.
Key features:
Which of my customers are worth the most, and which are overdue for their next order?
The Top Customers report ranks your customers by lifetime value, now or as of any date in the past, and shows which of them are overdue for their next order.
Key features:
What is an average customer worth over their lifetime?
The Lifetime Value report tracks average revenue per customer across your entire store, segmented by time period and by purchase behavior. This is the report to read before you decide what a new customer is worth paying for.
Key features:
How many of my customers are still active, and what are they worth on average?
The Active Customer Value report tracks the size and value of your active customer base over time, so the trend reflects the customers who are still buying instead of a flat all-time average.
Key features:
Example: Use the trend to correlate changes in customer value with marketing campaigns, product launches, or seasonal patterns.
What share of each month’s new customers keeps buying in later months?
The Cohort Retention report uses cohort analysis to show how well you retain the customers you acquire, month by month. Each row of the heatmap is a monthly cohort (the customers whose first order fell in that month), and each cell shows the percentage of that cohort who placed at least one order N months later.
Key features:
What percentage of my customers order more than once in the same period?
The Repeat Purchase Rate report tracks the share of customers who come back for another purchase, across whatever period suits your store. This is the quickest read on whether your retention efforts are working.
Key features:
Example: A rising repeat purchase rate means improving retention without additional acquisition cost.
How many first-time buyers come back, how far do they go, and how long does each step take?
The Order Sequence report follows the customers you acquired in a date range forward to today and shows where they fall away. It reports what share of them place a second order, a third, and a fourth, how long each of those steps takes, and what the order at each position is worth, so you can tell a store that struggles to win the second order from one that wins it easily and then loses people at the fourth.
Key features:
Example: If only 30% place a second order but 55% of those go on to a third, your money is better spent on winning the second order than on loyalty perks.
What percentage of my active customers stop buying during a period?
The Churn Rate report monitors customer attrition with a detection period tailored to your business cycle. It measures the share of active customers lost in each period, so you can see when customers stop purchasing and act on it.
Key features:
Example: Tracking churn over time is how you find out whether a retention campaign actually reduced attrition.
Which marketing channels bring customers who come back?
Find the marketing channels that create valuable customers, not just first sales. The Acquisition Sources report attributes every customer to the channel of their first order, using WooCommerce’s built-in order attribution data, then measures what those customers went on to be worth.
Key features:
Which countries bring the most sales, and which produce customers who come back?
The Countries report treats each market as a group of customers, not just a pile of orders, with customer measures next to the sales figures on every country row.
Key metrics by country:
Example: Your largest market by revenue is not always your best. A smaller country whose customers buy again and again can be worth more per customer acquired, which changes where the next marketing dollar goes.
Every report has a Customer role filter, so stores running role-based pricing, wholesale, or quote-request plugins can compare a WordPress user role (wholesale versus retail, for example) across lifetime value, retention, churn, and every other metric. Select Guests to see orders placed without an account. Your selection follows you from report to report, and the CSV export follows it too.
Every report also has a Product category filter. Pick one or more categories and the report covers only the customers who bought from them, with three ways to match them:
The filter chooses which customers are reported, not which sales are counted. Their lifetime value, order counts, and retention still cover everything they bought, right across your store, which is the whole point: a category that looks small on a sales report can be the one that brings in your most valuable customers.
Select several categories at once and you also choose whether customers have to match any of them or all of them. Any of them widens the net. All of them finds the crossover buyers, which is the question behind most cross-sell work. Selecting a category always includes its subcategories.
If your store has taken orders in more than one currency, every report gains a Currency selector. This matters more than it sounds: without it, amounts in different currencies are added together and labeled with your store currency, so an average lifetime value silently mixes euros into dollars, and the customer rankings in Top Customers and Customer Segments come out in the wrong order.
You have two ways to read a multi-currency store:
Your choice sets the currency symbol used throughout the charts, tables, and summary cards, and is recorded in the CSV export. Stores selling in a single currency see none of this.
Built to WordPress coding standards and designed for WooCommerce’s High-Performance Order Storage (HPOS).
Requirements:
Built to stay out of the way:
Install it, open the Analytics menu, and every report is already populated from the order history you have. In the first ten minutes you can see which customers are worth the most, find the valuable ones who have gone quiet, and send that group a coupon.
The Overview dashboard has a "Print / Save as PDF" button, which opens your browser's print dialog. Choose "Save as PDF" there and you have the file. Each page carries its number, so your browser's own "Headers and footers" option can stay switched off and its long admin web address stays off the page. Nothing is installed and nothing is sent anywhere, because your browser does the work. The ten individual reports export as CSV rather than PDF.
Some of them will, and the Overview dashboard tells you where you stand rather than showing a grid of zeros. Measures like retention, cohorts, and churn depend on repeat purchases, so they need a few months of trading before they mean anything. Until then the dashboard says how many customers and orders you have so far and points you at Top Customers, Countries, and Acquisition Sources, which are snapshots of whatever exists and are worth opening from day one.
Two reports answer this. Customer Segments puts your highest scoring customers in the Champions segment, the group that orders recently, often, and at a high value. Top Customers ranks every customer by lifetime value in a leaderboard, with their orders, average order value, last order, and predicted next order alongside.
The At Risk segment in Customer Segments holds customers who used to buy well and have gone quiet. Sort it by the Overdue column to bring the customers furthest past their own usual buying gap to the top, which is the list worth acting on first. The Churn Rate report gives the store-wide view of how many active customers stop buying in each period.
Select a segment in Customer Segments, or tick individual customers there or in Top Customers, and click Create coupon. You set the discount type, amount, expiry date, and code. The plugin creates a standard WooCommerce coupon restricted to those customers' email addresses and limited to one use per customer, then links you straight to the coupon editor.
Yes, from Customer Segments and Top Customers. Tick the customers you want, click Email selected, and choose Open in email client to start a message with their addresses in BCC, or Copy addresses to paste the list into a mailing tool. A selection carries across pages, and it is cleared when you change the date range or a filter. Because a link can only carry so many addresses, the handover to an email client is limited to 200 recipients, and copying has no limit. For a larger send, use the CSV export.
Yes. Click a customer's name in the Customer Segments or Top Customers report to open their profile. It lists every order they have placed, with its status, items, and net total after refunds, alongside their buying status, lifetime value, average order gap, predicted next order, the products they buy most, and how they were first acquired. The profile always covers the customer's whole history, whatever date range the report is showing. You can email the customer or create a coupon just for them from the profile.
Customer lifetime value (CLV) is the average net revenue a customer generates across their whole relationship with your store. The plugin groups every order by customer (guests by billing email), subtracts refunds to match WooCommerce's revenue, and averages across customers.
The predicted next order date comes from each customer's own buying rhythm. Their average order gap is the time from first to last order divided by the number of gaps between orders, and the predicted next order is one average gap after their last order. The Overdue column shows how far past that prediction they are, as a percentage of their own gap, so you can sort a segment by "most overdue versus their own pattern". The prediction needs at least two orders and an average gap of at least a day. Customers without a usable cadence show a dash. These columns appear in both the Customer Segments and Top Customers reports.
Yes. The Acquisition Sources report attributes each customer to the channel of their first order, using the order attribution data WooCommerce already records, and shows the average lifetime value of the customers each channel brought. WooCommerce's own attribution report is order-level and answers which channel made a sale. This one answers what the customers that channel brought turned out to be worth, which is how you tell a channel that delivers cheap first sales from one that delivers customers worth keeping.
Because their first order carries no attribution data. WooCommerce records the source of an order only while its Order Attribution feature is active, so orders placed before that, including your older order history, have none. Orders placed through the admin are recorded as such. When only a small share of the customers in range carry attribution data, the report displays a notice stating that share, so an "Unknown" row is never mistaken for a fault.
Use the Cohort Retention report. It groups customers by the month of their first order and shows what share of each cohort ordered again in each later month. Retention is observed through the last complete calendar month, so the month in progress does not pull the figures down, and the whole matrix can be exported as CSV.
They answer different questions and are meant to be read together. Repeat Purchase Rate is period-scoped: it asks what share of the customers who ordered within a period ordered twice within that same period, so a customer who buys in January and again in February counts as non-repeat in both months. Order Sequence is cohort-scoped: the date range picks customers by the date of their first order, and their whole subsequent history counts no matter when it happened. Order Sequence will normally report a higher figure, and that is expected rather than a discrepancy.
Because they have not had time to come back yet, and counting them as failures would make a recent date range look worse simply for being recent. A step only enters the funnel once the order it starts from is older than the maturation period, which defaults to your churn period (90 days) and can be changed on the page, including switching it off entirely. The report says above the funnel how many customers are being held out, counted at the first order. The same window applies at every later step, which is why a row's measurable base can be smaller than the number of customers who reached it.
A customer is counted as churned in a period if they were active at its start (they had ordered within your churn window, default 90 days) but placed no order by the period's end.
Repeat purchase rate is repeat customers ÷ total customers × 100, measured per period. A customer counts as "repeat" when they placed two or more orders within the period.
Yes. The Countries report breaks down net sales, orders, and items sold by billing country. Net sales are calculated on the same net basis as WooCommerce's native Revenue, Products, and Categories reports.
Each customer is counted once, under the billing country of their most recent order in the selected date range. Sales figures are attributed per order, so an order is always counted against its own billing country. A customer who ordered from two countries in the same period therefore adds orders to both country rows, but is counted as a customer in only one, which keeps customer counts from double-counting and lets the country counts add up to the period total.
It depends on the report. The value reports (Lifetime Value, Active Customer Value, Countries, Top Customers, Acquisition Sources, RFM monetary value) subtract refunds to match WooCommerce's native revenue. The behavioral reports (Churn Rate, Repeat Purchase Rate, Cohort Retention, Order Sequence) exclude fully refunded orders, since a refund isn't a real purchase. In Order Sequence that exclusion also keeps the numbering straight: a refunded order never takes up a place in the sequence, so it cannot push every later order down a position. The one money figure in that report, average order value by position, does subtract refunds.
Yes. Guest orders are grouped by their billing email address so each customer is counted consistently across reports.
Pick a role in the "Customer role" filter on any report, such as wholesale or retail, and compare lifetime value, retention, churn, and the rest between them. Roles are read as they stand today, since WordPress keeps no record of past role changes, so a customer moved to a different role appears under their new role for their whole order history.
Yes. Every report has a "Product category" filter that narrows it to the customers who ever purchased from a category, only ever purchased from it, or made their first purchase from it. It selects which customers are reported, not which sales are counted, so their lifetime value and retention still cover everything they bought across your store.
A purchased product counts as belonging to the category you selected if any of its categories match, so a product filed under both Coffee and Tea still counts as a coffee purchase for a Coffee filter. Buying any product with no matching category, including a product with no category at all, moves that customer out of the "only ever" group.
Yes. Once your store has taken orders in more than one currency, every report gains a "Currency" selector. Pick one currency to report on its orders alone, or set exchange rates in the settings to see every amount converted to your store currency. Converting excludes no orders and changes only the amounts.
You set them yourself under Analytics, Customer Analytics, Settings, where a rate field appears for each currency your store has taken orders in. Enter how much one unit of that currency is worth in your store currency, so 1.08 if one euro is worth 1.08 dollars. That single rate is then applied across your whole order history, which makes the converted figures a sound approximation for comparing markets and tracking trends, rather than an exact reconstruction of what each order was worth on the day it was placed. If you need exact per-order amounts, report on one currency at a time instead, which uses no rates at all. Until every currency has a rate, the "All currencies" option is not offered.
Yes. Subscription orders from WooCommerce Subscriptions are included in the calculations like regular orders.
Reports always use current data from your WooCommerce database, so each report reflects your orders as they are at the time you view it.
No. All calculations run on your own server using data already in your WooCommerce database. There are no external dependencies and no customer data is shared with third parties.
Yes. The plugin reads order data from WooCommerce's High-Performance Order Storage (HPOS), so HPOS must be enabled. It also needs current versions of WordPress, WooCommerce, PHP, and MySQL or MariaDB. See the Requirements section on this page for the exact minimums.
Yes. Every report includes a CSV download. The Customer Segments export includes each customer's email address and segment, which is useful for external analysis or marketing tools.
Extension information
Quality Checks
Countries