
The Variations report shows the sales and inventory performance of each product variation in your store. Go to Analytics > Variations to open it.
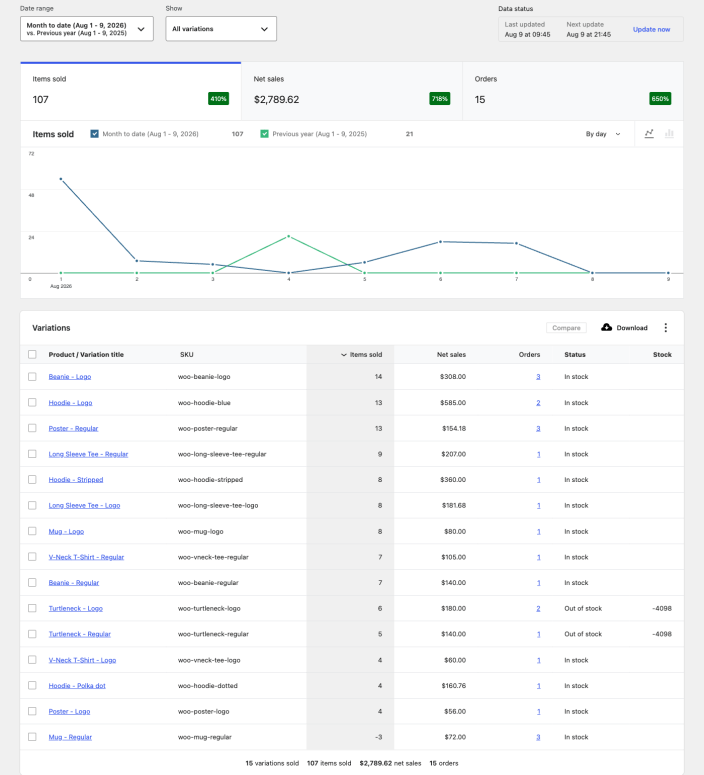
Report overview
↑ Back to topUse the Date range control to choose the reporting period and, optionally, compare it with the previous period or previous year. The performance indicators summarize Items sold, Net sales, and Orders. Select a performance indicator to change the metric shown in the chart.
Filter and compare variations
↑ Back to topOpen the Show menu to switch between these views:
- All variations shows every variation with sales in the selected period.
- Single variation limits the report to one variation.
- Comparison compares two or more variations.
- Advanced filters filters variations by product, product attribute, or product category.
Advanced filters can match All conditions or Any condition. You can also select variation rows in the table and then select Compare.
Read the variations table
↑ Back to topThe table contains these columns:
- Product or variation title
- SKU
- Items sold
- Net sales
- Orders
- Status
- Stock
Select a sortable column heading to change the table order. Select a product or variation title to edit the product. Select an order count to open the Orders report filtered to that variation.
Understand net sales
↑ Back to topNet sales subtracts refunds and coupon discounts from the variation’s gross sales: (variation price × quantity) − refunds − coupons.