
The Categories report shows how each product category contributes to your store’s sales. Go to Analytics > Categories to open it.
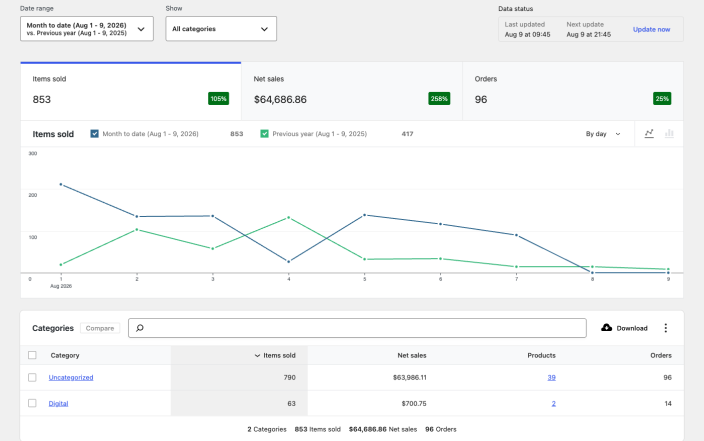
Report overview
↑ Back to topUse the Date range control to choose the reporting period and, optionally, compare it with the previous period or previous year. The performance indicators summarize Items sold, Net sales, and Orders. Select a performance indicator to change the metric shown in the chart.
By default, the table includes all categories and is ordered by items sold. Its columns are:
- Category
- Items sold
- Net sales
- Products
- Orders
Filter and compare categories
↑ Back to topOpen the Show menu to switch between these views:
- All categories shows every category with sales in the selected period.
- Single category limits the report to one category.
- Comparison compares two or more categories.
For a single-category or comparison view, begin typing a category name, select the matching category, and apply the filter. You can also select category rows in the table and then select Compare. Use the search field above the table to narrow the displayed rows.
Understand totals
↑ Back to topThe sum of the table rows may differ from the totals shown beneath the table. A product can belong to more than one category, so its sales are included in each assigned category. Sales from child categories are also included in their parent category totals.
Use report links
↑ Back to topSelect a category name or its product count to open the report filtered to that category. Select a column heading to sort the table by that column.