Data is the key to growth. It tells how customers are responding to your marketing campaigns so you know what’s working and what to improve to increase sales. Many store owners don’t use the data available to them, but spending even a moderate amount of time understanding your metrics leads to faster revenue growth.
There are a number of places you can find site stats, and each serve their own role. Jetpack site stats, for example, provides quick answers to your most popular questions and lets you compare essential site metrics over time. Your WooCommerce dashboard offers enhanced sales data. And for even more insight, there’s Google Analytics. After you install a basic tag on your site, it provides powerful information on which products are the most popular, where your revenue comes from, how many people make recurring purchases, and more.
In this article, we’ll look at how to collect and interpret basic reports if you’re just getting started. Then, for advanced users, we’ll explore two new aspects that take things a step further: UTM tracking and Google Analytics Pro.
Before you begin, keep in mind that audience tracking should always be done ethically and in accordance with any government or industry regulations that may apply to your business. The General Data Protection Regulation, for example, applies to any company with traffic from countries in the European Union, even if you’re based somewhere else. View our GDPR resources to learn more, but keep in mind that your business may be subject to other rules.
If you’re just starting
↑ Back to topEven if you don’t understand what all of the numbers mean, begin tracking right away. The sooner you start collecting data, the more information you’ll have to analyze when the time is right.
WooCommerce offers a free Google Analytics extension that makes it simple to use core Google Analytics features. With a little investigation, you can identify major trends and adjust your store to better suit the needs of your customers.
Note: Click any image in this post to get a closer look.
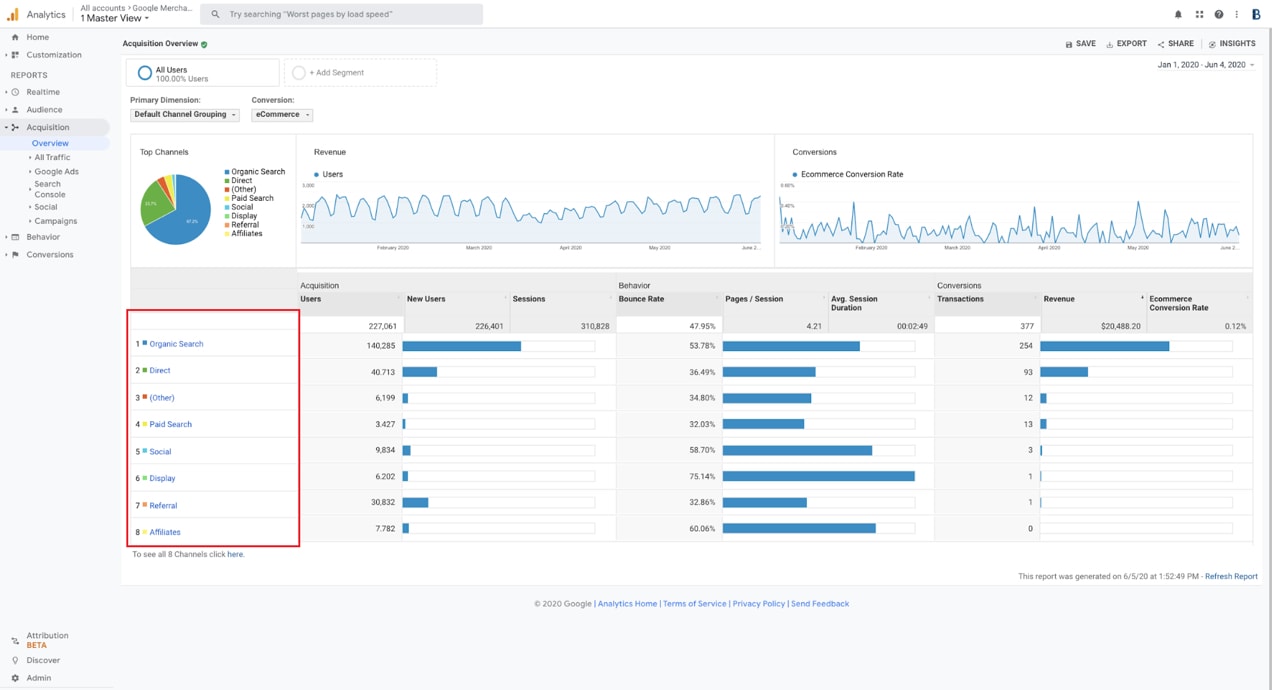
The report above is a great example of the powerful information you can discover with Google Analytics. It can be found by navigating to Acquisition → Overview. You can see the volume of traffic from a variety of broad (social media, organic, referral traffic, etc.) sources along with the bounce rate and number of pages viewed for each. Even more importantly, on the far right, you can see the revenue that’s attributed to each source.
By clicking on a category in the left column (outlined in red), you can access more information. If you select Social, you’ll find a list of the specific platforms that generated traffic to your site (Facebook, Twitter, Pinterest, and more) and the same information for each: traffic volume, page views, bounce rate, etc.
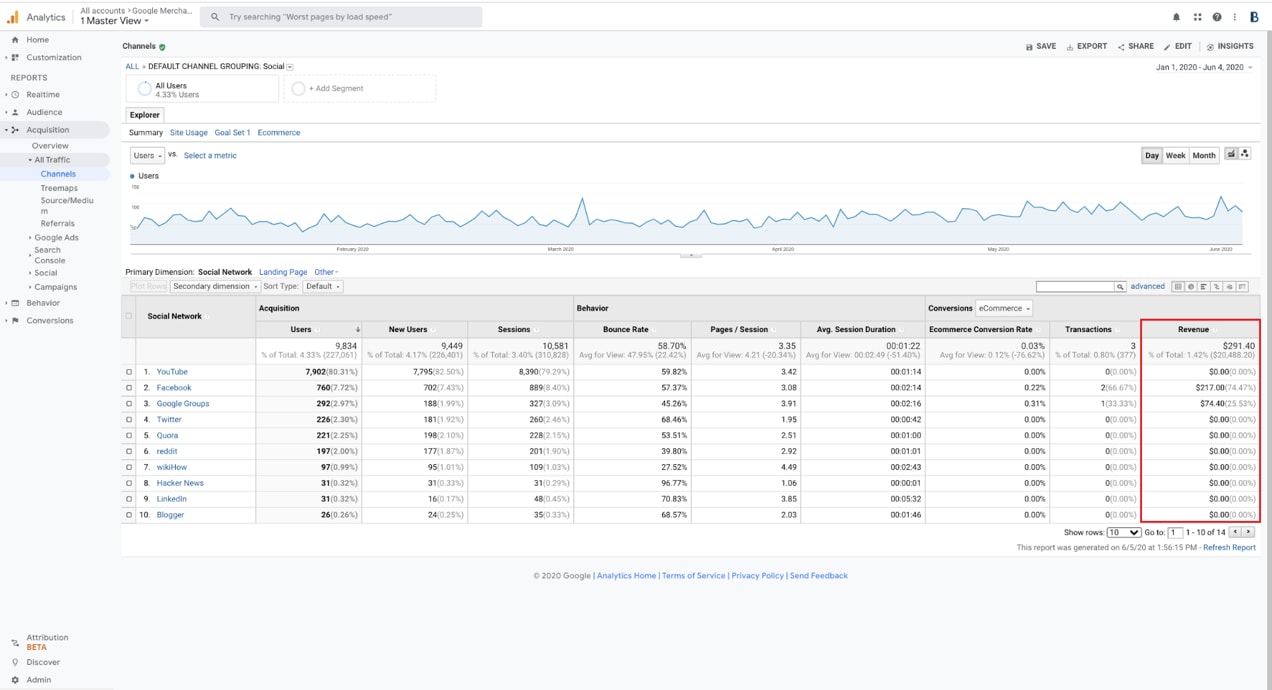
You can find the revenue attributed to each platform on the far right. In this case, YouTube generates the most traffic, but none of the sales. Based on traffic numbers alone, you might think you need to spend more on YouTube advertising, even though it’s not generating any actual sales — the revenue data is key. And in this case, Facebook is actually the main source of revenue from social media traffic.
This is just a fraction of what you can learn. Go here to discover more about the basics of Google Analytics. If you’re ready for more advanced analysis, keep reading!
For growing stores
↑ Back to topAs your store grows, keep an even closer eye on ecommerce analytics. A one percent improvement in conversion rate could equate to thousands of dollars in new sales.
In this section we’re going to look at two more advanced analytics tools that empower you to make better, data-driven decisions for your store. Either of these, if used on their own, will enhance your tracking capabilities. When combined, you’ll be equipped with the most advanced data interpretation available. Find out how to:
- Track specific traffic sources and get more precise data using your Google Analytics dashboard.
- Access advanced eCommerce reports.
Track specific sources with UTM parameters
↑ Back to topNote: The acronym UTM stands for “Urchin Tracking Module” and comes from the Urchin Software Corporation that was purchased by Google in 2005. They created an application to track and measure web traffic, which would later become known as Google Analytics.
UTM parameters are extra information that you can include at the ends of links in your ads. They don’t affect the destination of the URL, but give Google crucial information about the source of the click. If you’ve ever seen incredibly long URLs that don’t quite make sense, you may be looking at a link with UTM parameters attached.
What can you track?
You can track the following categories using UTMs:
- Source: Where traffic originates (Facebook, Google, a specific website, etc.)
- Medium: The general marketing medium where this link appears (paid search, banner, ecommerce email marketing campaigns, etc.)
- Campaign Term: The keyword or audience you’re targeting
- Campaign Content: The name of your ads, so you can tell them apart.
- Campaign Name: The name of your broader marketing campaign. You might just call this “anniversary.”
To create a UTM, marketers start with the main URL and then add a question mark to separate it from the tracking information. Then they add:
- “utm_”
- The type of parameter
- “=title” of the parameter
An ampersand (&) goes between each parameter.
So, in practice, a link might look like:
www.woocommerce.com/example-marketing-campaign?utm_source=facebook&utm_medium=cpc&utm_campaign=anniversary&utm_content=red
The link above is for a CPC (cost per click) Facebook ad as part of a hypothetical anniversary campaign. We used “red” in the content parameter to track the results from ads with a red background. For a blue ad, we would simply change the end to “&utm_content=blue.”
Why should online stores use UTMs?
Using parameters allows you to collect more segmented data about the results of your campaigns. You can differentiate site visitors from different sources, ads, and more, and use that information to make better, more precise decisions.
Without UTMs, Google Analytics may show that 20% of your traffic came from Facebook and had a 60% bounce rate. But with UTMs, you can separate paid from organic traffic, or distinguish traffic coming from different campaigns.
Let’s say you’re running a sale to celebrate your store anniversary. UTM parameters can tell you that banner ads with a red background produce traffic with different attributes (lower bounce rates, higher average order value, etc.) than the same ad with a blue background. You can also distinguish between target audiences and campaigns.
When running ads, the platform you use typically supplies you with basic results. For your anniversary campaign, Facebook might tell you which ad received more clicks, had a lower cost per click, or resulted in more sales. (Of course, you have to have Facebook’s tracking pixel installed correctly — this extension does the work for you). But you can’t see what happens on your site between the ad click and the conversion. How many pages do visitors view? What percentage of people added an item to their cart or tried a coupon code? Which pages are most popular with the people who clicked each ad?
Maybe you’re targeting two audiences with the anniversary campaign: your existing customer base, and new people who’ve indicated an interest in your products and live in a certain area. Using UTMs, you might notice that the most popular page for new people was your “clearance” page, while traffic from your existing customer base preferred the “new releases” page. With that knowledge, you can improve future campaigns by adjusting ads to promote clearance items to the new audience and new products to your existing customers.
Influencers and affiliates
Many stores partner with influencers or affiliates for promotions. You can use UTMs to identify this traffic and determine which partners give you the most value.
See it in action
Earlier, you discovered that YouTube accounted for the majority of social media traffic, but Facebook was responsible for the majority of sales. Without UTMs, you wouldn’t be able to distinguish organic and paid Facebook traffic, so, if you paid to boost Facebook posts in the past and see that Facebook is responsible for the majority of revenue from social media, you might assume you should run more promotions.
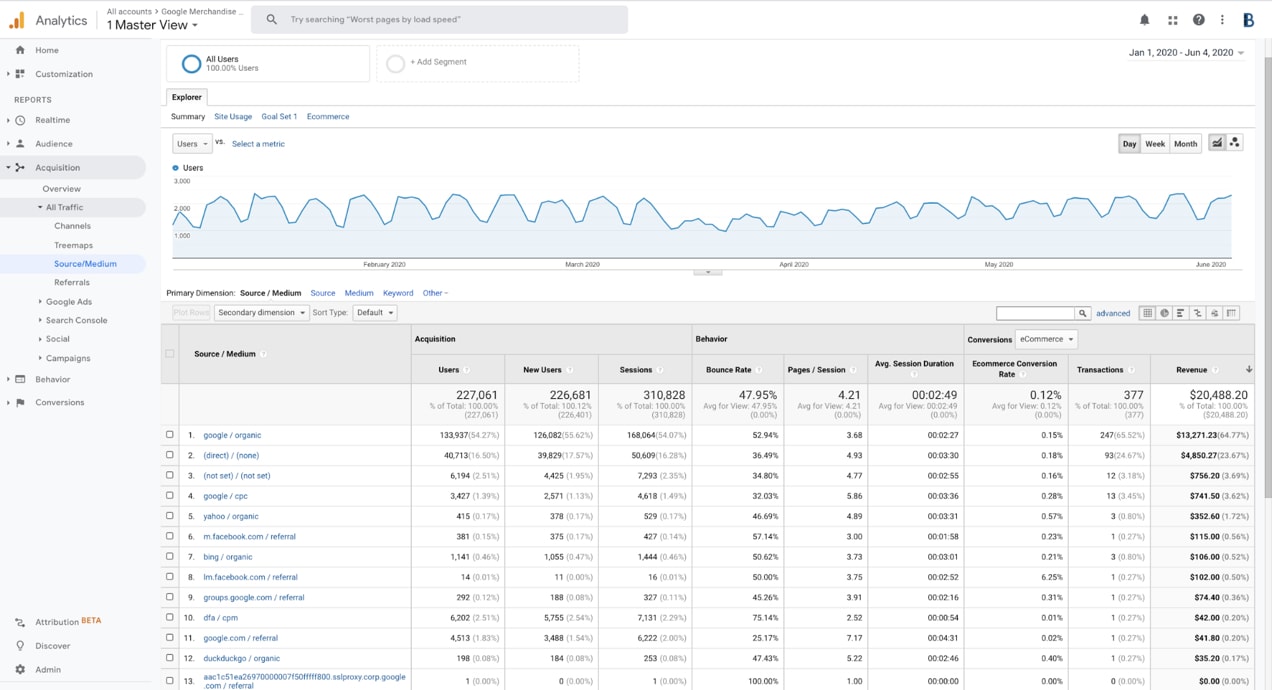
With UTMs you can also see that most of your revenue from Facebook is from “Facebook.com / referral“ instead of what you used for the link in the ads, “Facebook.com / CPC”. That’s organic traffic — you might think twice about pouring more money into ads.
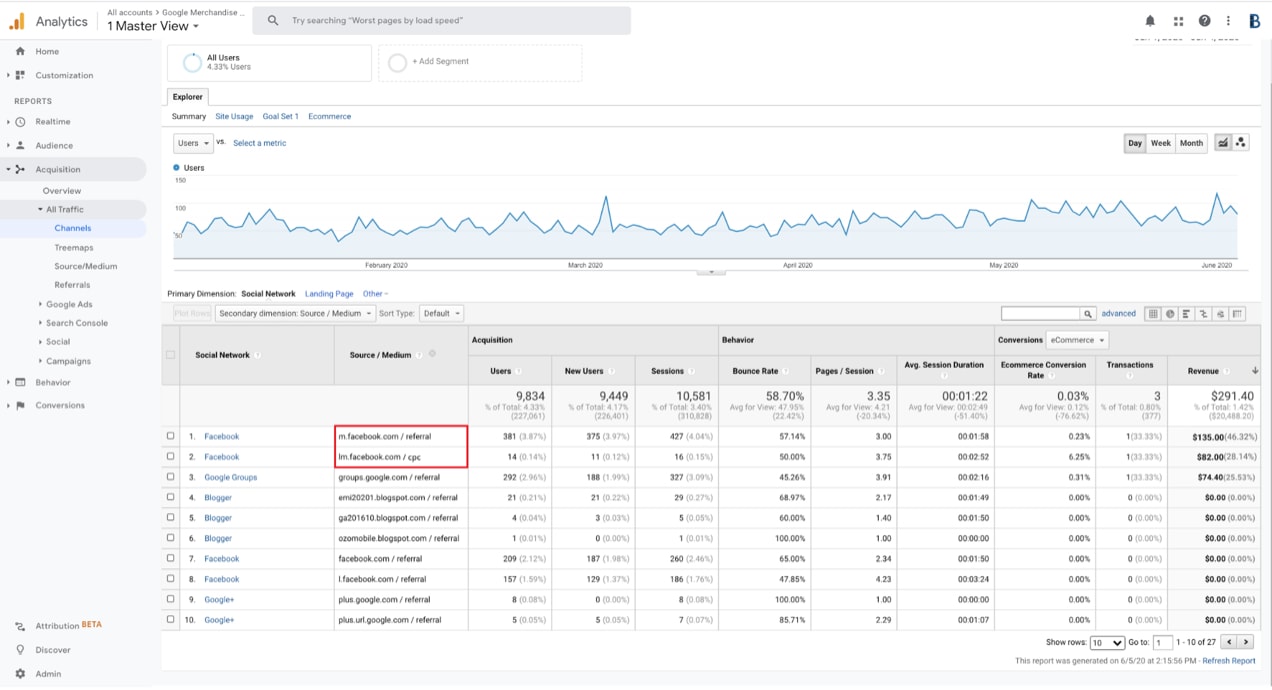
You can do this for more than social media referrals. Go to Acquisition → All Traffic → Source/Medium to see the results for all your source/medium tags. In the far right column, sort your revenue from greatest to least to see the most impactful sources for sales.
Go further
Let’s go one level deeper to see why UTMs are so powerful. So far, you’ve only used the UTM tags for source/medium and you already have much better data. But let’s say you’re not just boosting the occasional post on Facebook, but have multiple campaigns at the same time. The distinction between paid and referral traffic from Facebook wouldn’t help you determine which paid Facebook campaigns are performing well and which ones you should ditch. This is where the Campaign tag comes into play.
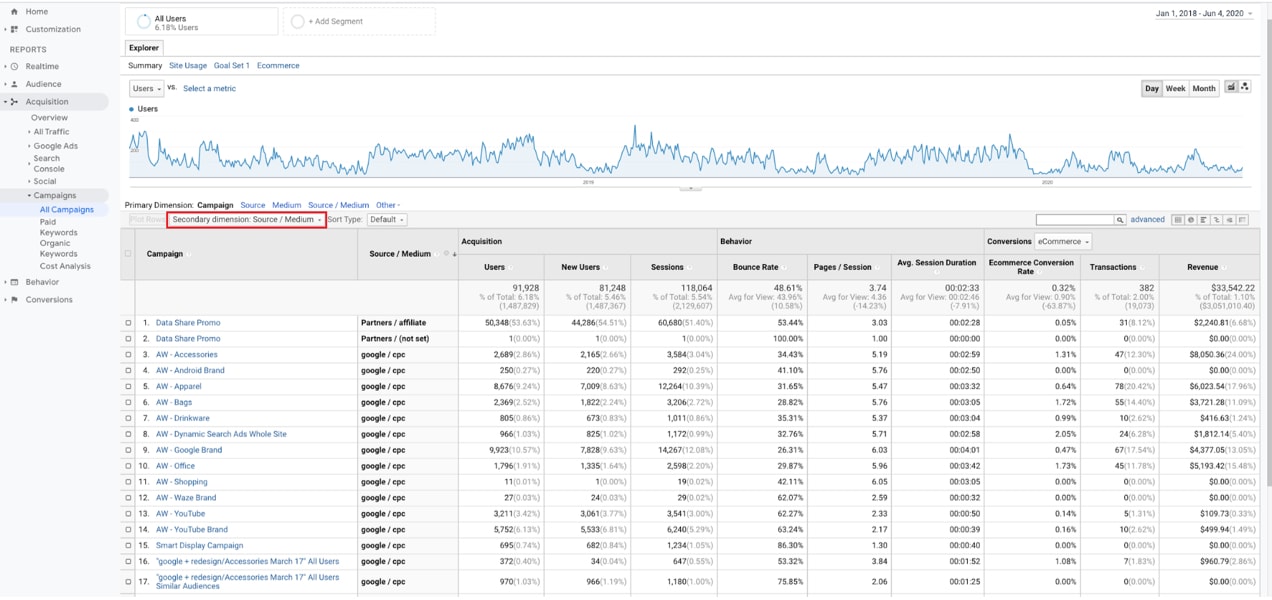
Go to Acquisition → Campaigns → All Campaigns.
You can see the results of each campaign you’ve named and evaluate its performance. Add a secondary dimension (outlined in red) for source/medium if you have multiple campaigns on several platforms. This allows you to quickly distinguish the best performing campaigns on each platform.
Make your own UTMs
Though UTMs can be created manually, it’s easy to make mistakes. We recommend Google’s URL builder to streamline this process.
You can use any text you want for the parameters, but keep in mind:
- These are publicly visible. Don’t include anything you wouldn’t want your customers to see.
- Establish a pattern and be careful about using parameters in ways other than their original intent. UTMs are case sensitive and, without standard procedures, data can get disjointed and complicated quickly.
- Keep a spreadsheet of all of the links you create. Use it to keep track of links, and as a place to keep additional context and information.
Now that you’ve segmented your data and brought it into a single place for review, it’s time for even deeper insights.
Google Analytics Pro, advanced reports for eCommerce
↑ Back to topGoogle Analytics Pro helps store owners take advantage of the advanced Google Analytics features to better track each visitor’s journey and identify tiny trends that can lead to major opportunities.
Access visual funnels that show where visitors abandoned the checkout process, how many people tried coupons, or how many customers logged in and out of their accounts — all information you can use to improve sales. You can even track when a purchase is complete but the user doesn’t make it to the thank you page. Many ad platforms rely on this thank-you page to provide conversion data and can miss these kinds of conversions. Google Analytics Pro gives you more accurate data.
Even without UTMs, Google Analytics Pro makes it simple to unlock deeper insights available as part of Google Analytics; you just won’t be able to segment traffic based on specific attributes. So, you can get new information on Facebook traffic, but it won’t distinguish between paid and organic traffic, much less specific campaigns.
We’ve created a chart that compares the free Google Analytics extension to Google Analytics Pro. But in summary, the pro version offers everything available in the free version but with added power:
- Track average order values, conversion rates, and sales by product or category. Then, filter these by other metrics for enhanced conclusions like which traffic source provides the highest average order total.
- Get more accurate user counts. Exclude shop managers from tracking so they don’t skew your data.
- Use advanced event tracking to more precisely identify trends and areas that need improvement. See when coupons are added or removed, items are added to carts, quantities are changed, customers sign in, customers select a payment method, and much more.
- Enjoy enhanced link attribution. Track multiple links to the same URL on a single page.
- Identify metrics from hidden sales that occur when checkout is completed but the shopper doesn’t reach the thank you page.
Checkout Behavior Analysis
↑ Back to topOne of the most helpful aspects of Google Analytics that’s unlocked with the Pro extension is Checkout Behavior Analysis.
This allows you to see, with a funnel visualization, how successfully your visitors moved through the checkout process. What step causes the greatest percentage of people to abandon the process? Is it the shipping information page? Shoppers must not like what they see. Is it earlier, in the Create an Account section? Maybe they don’t want to create an account.
You can even segment these groups further — e.g., everyone who went to step one and step two, but not step three — for more clues about what people in this group have in common and how you might improve their experience to get more sales.
With UTMs, you can see how specific segments moved through the funnel. Maybe visitors in your existing customer Facebook audience who clicked the blue ad commonly abandon checkout at the same point.
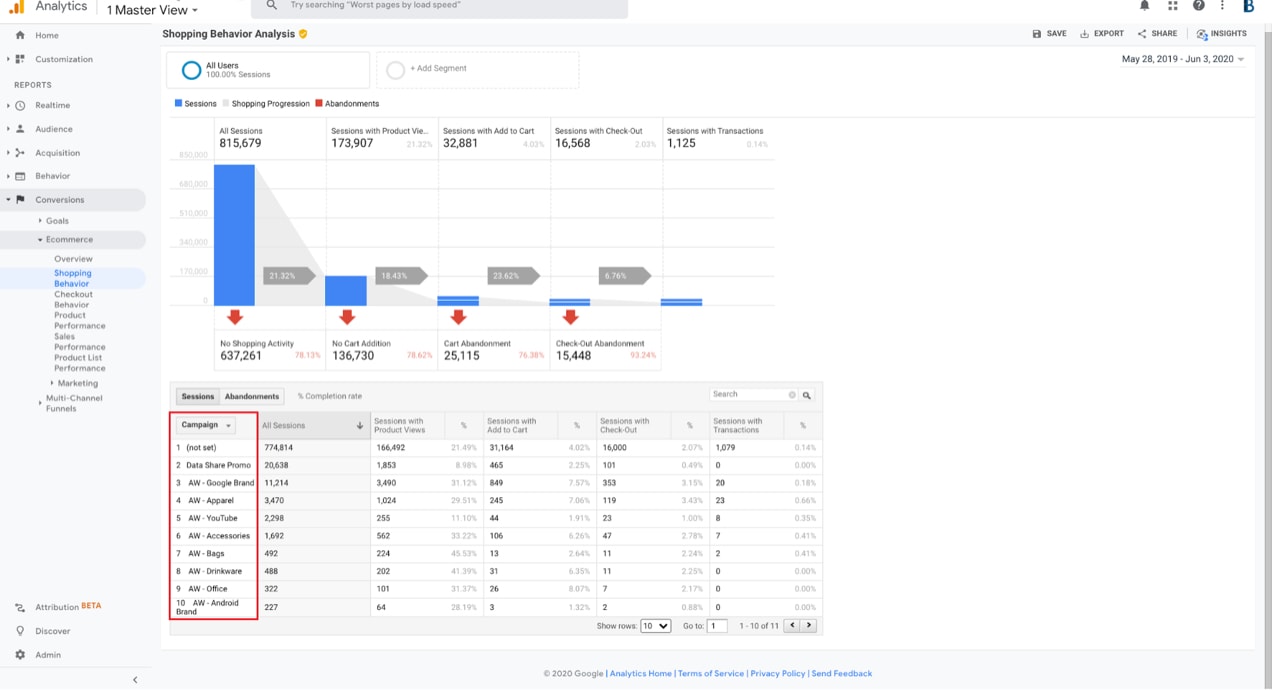
Get to the Shopping Behavior Analysis report above by going to Conversions → Ecommerce → Shopping Behavior. We’ve sorted it by campaign (highlighted in red above).
The far right column shows the sessions with transactions. Though the top row has the highest number of transactions, the fourth row has the best conversion rate by percentage. Let’s assume this was an experimental campaign that just ended. Based on this report, you might want to pour more money into this campaign and continue to see if it’s a top performer.
Compare “Sessions with Add to Cart” to “Sessions with Check-Out” to identify trends. Of the campaigns, the second row has the greatest dropoff between add to cart and checkout, so take a look at your customer experience in this area to understand what’s impacting this audience. Maybe you have a pop-up showing related products that appears right after someone adds something to their cart. This particular audience may be so frustrated by this that they leave completely, so maybe you can disable this function when you run this campaign in the future.
If you look further, you can see that the second row also has the lowest ratio of sessions to product views, by far. With this additional consideration, and knowing that this audience completed zero transactions despite being the second-largest source of traffic, it might be best to assume that this campaign was a dud and not even try to fix it. There are more promising campaigns to focus on first.
Track like a pro: use UTMs and GA Pro together
↑ Back to topThe fastest-growing and top-performing eCommerce stores invest heavily in understanding data. It improves your results across a variety of areas, from product sourcing to marketing and customer service. But you don’t have to be a data expert to get started! The Google Analytics extension helps you collect essential information about your store. And the sooner you install it the better, even if you don’t use it right away.
As you get more WooCommerce traffic and want to enhance your efforts, you can use UTMs to distinguish between audiences, campaigns, traffic sources, and individual ads. When paired with the Google Analytics Pro extension and the ability to unlock even more advanced reports, you’ll be tracking like an expert and benefiting from the results.
About


