 This is a guest post from Ned Dwyer, founder of Tweaky.com – the easiest way to tweak your website from $39 per tweak. Ned is passionate about digital marketing, startups and peanut butter.
One of the biggest challenges for anyone working in social media or content marketing is reporting. It’s always a lot easier to start writing a blog post or engaging fans on Facebook than it is to wrangle with the beast that is Google Analytics.
After all, producing a kick ass infographic is usually more fun than generating a report from Google Analytics right? Unfortunately it’s true but I hope to change all of that.
In this post I want to show you 3 essential, but also really simple, custom reports you can use in Google Analytics to measure your social media and content marketing campaigns. Too many companies actively market their website but do a poor job when it comes to measuring performance, optimizing and improving.
Let’s make sure your business doesn’t fall into that category!
Before we begin… what is Custom Reports?
If you haven’t used custom reports before it’s a great feature I love in Google Analytics that allows you to create your own reports, with custom columns and rows, instead of the stock standard formats.
You can find via the Customization tab up the top of your Google Analytics Account.
Report 1 – How well is my blog doing?
One of the most important properties for every content marketer is the home blog. You’re producing lots of great content, people are coming to the site but what are they doing when they land?
Are they signing up for a newsletter? Are they they creating an account? How do you know if your content is making a difference to the bottom line?
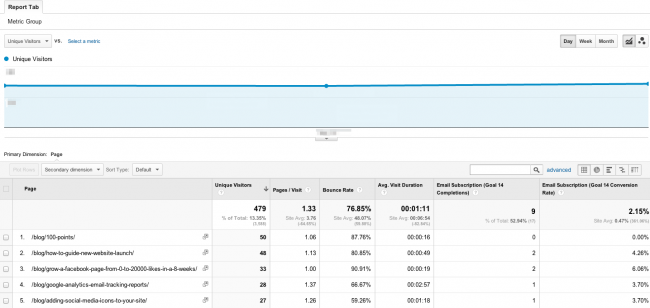
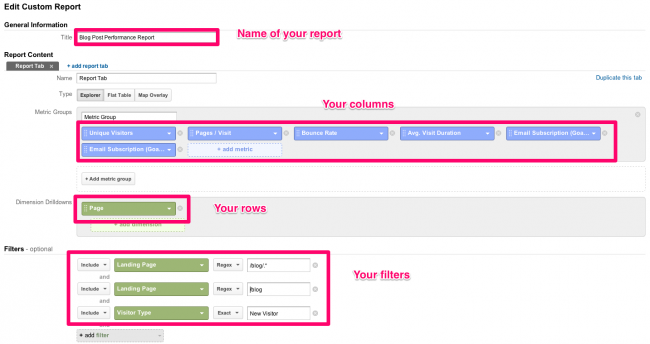
These questions can be answered quite easily using a custom report I call “Blog Post Performance”. In this report we want to analyse individual posts and how well they’ve done in terms of engagement metrics (pages/visit, avg visit duration, bounce rate) as well as conversions (email subscription, ebook download etc).
You will also want to filter this report to just new visitors. People who’ve never been to your blog before and are seeing it for the first time!
You’ll notice that we’ve added Email Subscription goals as one of our columns. This is a custom event goal that we’ve created to track anyone who clicks submit on the Subscribe to our email newsletter button. Email subscriptions is a key goal for us at Tweaky.
If you run a blog on a company website you’re likely to have your blog located in a subfolder like /blog. To keep your report nice and tight remember to create the filter to only show blog content as shown above.
After you’ve set all this up this should be your end result. Now you have one report you can quickly look over to see which blog posts are producing the best results.

Get this Blog Post Performance Report in your Google Analytics account.
Report 2 – How well are my guest posts doing?
A big part of any content marketing strategy is Guest Blogging – the practice of writing content for other blogs to expose your brand to a wider audience and drive traffic.
If you’re regularly blogging for other blogs you’re probably wondering how well your guest posts are doing. So how do you measure this?
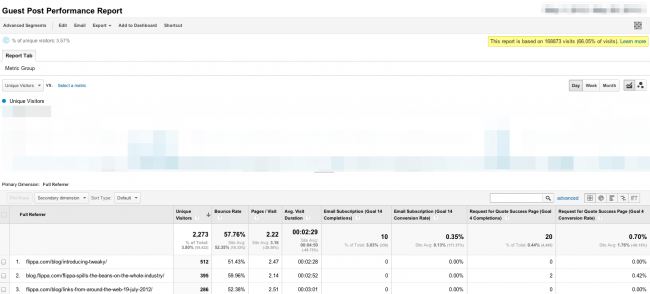
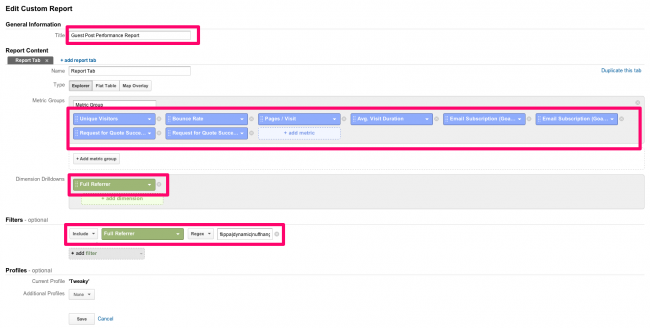
Thankfully Google Analytics makes this really easy. Again jumping back into custom reports we create a report with similar columns showing user engagement metrics (bounce rate, pages/visit etc) as well as conversion metrics (email subscriptions, purchases etc).
This time our rows are focused on full referrer. This displays the full URL of the referring website page that links to your site.
In the filter section you will need to use Google Analytics Regex to ensure you only see guest blog posts. In this example we only wanted to see blog posts from partners like Flippa and Nuffnang etc.
With all that done, this is what you should see as an end result!

Get this Guest Blog Report in your Google Analytics account.
What content performs best on social media?
↑ Back to topGreat content goes hand in hand with social media marketing. If you’ve got awesome content you need it to be discovered and spread it channels like Twitter, Facebook, LinkedIn, Pinterest etc. So how do you measure how well your social media distribution is going?
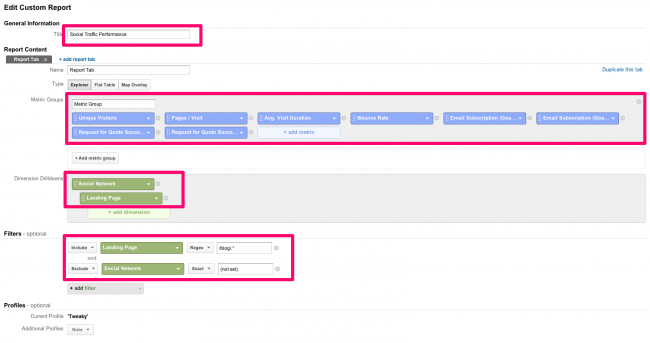
Again we’re keeping the same engagement metrics but this time we’re looking specifically at social networks.
We’ve placed a few specific filters on this report. The first is making sure it’s reporting just on visits where the person has landed on the blog of our site (i.e these visits are related to our content marketing).
I’m also filtering it so that the report does not show any (not set) values. Not set refers to any row entry where Analytics does not have data to identify the specific social network.
You’ll also notice that I’ve placed landing page below social network in the Dimension Drilldown section. This sets the report to first show rows based on social network. If you then click on specific social network you’ll be able to see the specific pages getting traffic from that network.


Get this Social Media Marketing Report in your Google Analytics account today.
Conclusion
↑ Back to topIf you haven’t already been using Google Analytics Custom Reports this should be the push to get you onto it. If you’re heavily involved in content and social media marketing you need to beusing custom reports.
Not only are they easy to use they are also incredibly powerful and will help you make huge improvements in optimizing your online marketing efforts!
What do you think of these custom reports? Any improvements you could see us adding? We’d love to hear your experience with Google Analytics Custom Reports. Share in the comments below!
Join Us & Learn
↑ Back to topIf you could use some help figuring out Google Analytics join us for a special webinar to learn more.
Thursday, July 11 at 03:00 PM MST Tweaky & WooThemes are hosting a FREE Google Analytics 101 Webinar – Understanding and Maximising Google Analytics. Sign Up Here
About



Great to see content like this, will it be added to the tutorials section?
Thanks Grumbledook, glad you’re digging it.
Mark – happy for you guys to add this kind of thing to tutorials section if it makes sense for you.
Would love to see better screenshots for these walkthroughs. The text is hardly readable and when clicking through there is no full-res version.
Fair call Nick. It’s hard to get a good screenshot when there is a lot of information on the page.
If you click through to the image you can zoom in with COMMAND + if that’s any consolation.
If you’re using Firefox or Chrome, open the image in a new tab or window, then click the image using the magnifying-glass cursor that appears. This will zoom to 100%.
1111
Good blog post thanks. What do you think of the new Beta Analytics?
Thanks
George
Nice blog about content marketing and social media.but all the screenshot you take is not clear and i am not understading that so please clear that.otherwise your blog was very nice.thanks for sharing.
Great blog Mark I just realized that Google Analytics has been having a nice makeover. I see they also have a lot of mobile stuff on here too I think I need to check this out in more detail. The design and UI layout they have is very neat and loads fast.
Unanimously agree! The flow of content establishes your expertise in your field and can really go a long way toward building your brand and helping you establish a loyal following of potential future customers.
Trending
What is branding? How to create a lasting ecommerce brand
By Mahrie Boyle •
How Landyachtz built a personalized growth engine with Klaviyo and WooCommerce
By Mahrie Boyle •
How to create buyer personas for your online store
By Kathryn Marr •
Never miss a beat — join our mailing list
Please enter a valid email.
View our privacy policy. You can unsubscribe anytime.
There was an error subscribing; please try again later.
Thanks for subscribing!
Emails will be sent to
You're already subscribed!
Emails are sent to