Installation
↑ Back to topRequirements
↑ Back to top- WordPress 6.0 or later
- WooCommerce 7.0 or later
- PHP version: 7.4 or higher
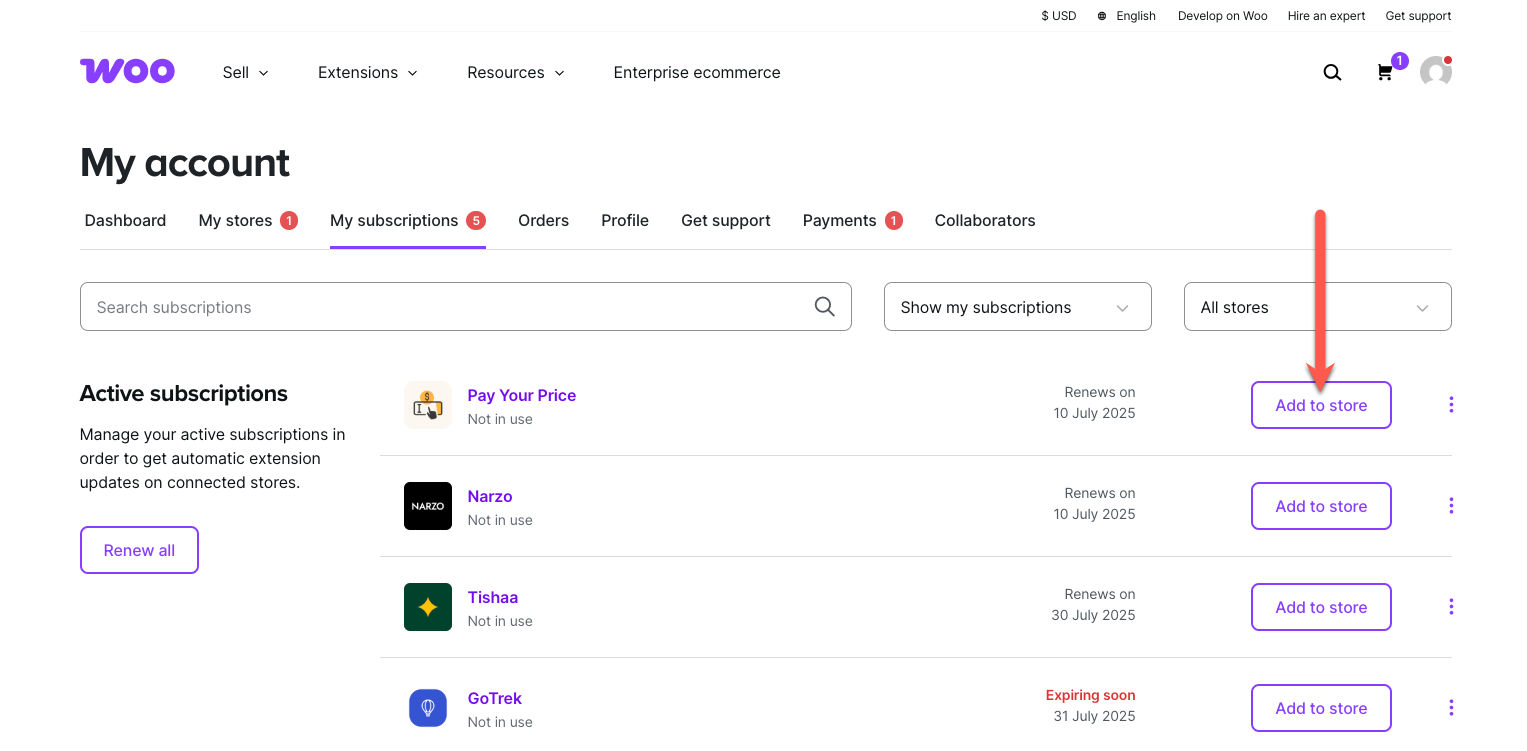
To start using a product from WooCommerce.com, you can use the “Add to store” functionality on the order confirmation page or the My subscriptions section in your account.
Alternative opion:
- Upload the plugin ZIP via Plugins → Add New → Upload Plugin
- Activate the plugin
1. Getting Started
↑ Back to top1.1 System Requirements
↑ Back to topBefore installing the plugin, ensure your environment meets the following:
- WordPress 5.8 or higher
- WooCommerce 6.0 or higher (installed & activated)
- PHP 7.4 or higher (8.1+ recommended)
- MySQL 5.6+ / MariaDB 10.3+
- Minimum 128 MB PHP memory (256 MB recommended)
- Administrator access
1.2 Initial Setup
↑ Back to topAfter activation:
- Navigate to:
WordPress Admin → Neural Commerce → Settings - Configure the following:
- General Settings – currency, calculations, and basic options
- Alert Settings – profit/margin alerts and email notifications
- AI Settings – connect AI provider (if applicable)
- Advanced Settings – performance and cache options
1.3 Dashboard Overview
↑ Back to topThe plugin provides two dashboard views:
- Advanced Dashboard
Path: Neural Commerce → Dashboard- Detailed analytics
- Charts, reports, AI insights
1.4 You’re Ready
↑ Back to topOnce setup is complete, you can start:
- Adding product costs
- Tracking profit and margins
- Viewing analytics and reports
- Setting automated alerts
2. Product Cost Management
↑ Back to top2.1 Overview
↑ Back to topThe Cost Management system is a core component of the plugin, designed to help you accurately define, organize, and analyze all product-related costs in one place. Its primary objective is to ensure precise calculation of profit and margins by accounting for every expense associated with a product.
At the center of this system is the Product Costs dashboard, a unified interface where all cost-related operations are performed. Instead of managing costs individually within each product page, this centralized approach allows you to efficiently oversee, update, and monitor cost data across your entire catalog, improving both accuracy and workflow efficiency.
2.2 Adding Product Cost
↑ Back to topAdding or editing product costs is designed to be simple and intuitive.
To begin, navigate to:
WooCommerce → NeuralCommerce → Product Costs
Here, you will find a structured table displaying key product data, including product name, SKU, selling price, cost, and calculated profit and margin. This overview enables quick identification of product performance at a glance.
To add or update costs:
- Click “+ Add New Cost” located at the top right, or
- Click “Edit” next to an existing product
A popup (modal window) will open, allowing you to input cost details. You can enter the base product cost and optionally include additional cost components depending on your requirements. Once saved, the system automatically recalculates profitability metrics without requiring any manual computation.
2.3 Cost Components
↑ Back to topThe system supports multiple cost inputs to ensure comprehensive cost tracking. These include:
- Product Cost – the base purchase or manufacturing cost
- Shipping Cost – expenses related to logistics and delivery
- Handling Cost – packaging, labor, or operational handling charges
- Transaction Fees – payment gateway or processing charges
- Other Costs – any additional or miscellaneous expenses
All these components are aggregated to determine the total cost price, ensuring that no hidden or indirect expense is overlooked in profit calculations.
2.4 Managing Costs from Dashboard
↑ Back to topAll cost-related operations are performed from a single, centralized dashboard. This allows you to:
- View all products in a clean, structured table
- Edit costs quickly using inline actions
- Monitor profit and margin values in real time
This approach significantly reduces the need to navigate between multiple product pages and ensures consistency across your entire store.
2.5 Bulk Cost Management
↑ Back to topFor stores with large product catalogs, bulk cost management becomes essential. The system enables efficient handling of multiple products simultaneously by:
- Allowing quick updates directly within the Product Costs table
- Supporting consistent cost structures across similar products
- Eliminating repetitive manual entry
This not only saves time but also minimizes the risk of inconsistencies in cost data.
2.6 Profit & Margin Calculation
↑ Back to topAll profitability metrics are calculated automatically based on the cost inputs provided. The system uses the following logic:
- Profit = Selling Price – Total Cost
- Margin (%) = (Profit ÷ Selling Price) × 100
These values are updated instantly whenever any cost component is modified, ensuring that your financial insights are always current and accurate.
2.7 Cost Visibility & Control
↑ Back to topCost-related data is strictly restricted to the administrative environment.
- Only users with authorized roles can access cost and profit information
- Customers and front-end users never see this data
- Sensitive financial details remain secure within the dashboard
This ensures both operational confidentiality and data integrity.
2.8 Alerts & Monitoring
↑ Back to topTo help maintain healthy profitability, the system includes monitoring capabilities such as:
- Minimum margin threshold tracking
- Identification of loss-making products
- Automated alerts (when enabled in settings)
These features allow you to proactively identify and address issues before they impact overall business performance.
2.9 Import & Export
↑ Back to topThe plugin supports seamless data transfer for better management and external analysis:
- Import product cost data using CSV files for bulk updates
- Export cost, profit, and margin reports for accounting or reporting purposes
This functionality is particularly useful for integrating with external tools or maintaining financial records.
2.10 Best Practices
↑ Back to topTo maximize the effectiveness of the Cost Management system:
- Update product costs regularly to reflect real-world changes
- Ensure all direct and indirect expenses are included
- Monitor low-margin or loss-making products consistently
- Use the centralized dashboard to maintain uniformity across products
Following these practices will help maintain accurate profitability tracking and support better decision-making for your WooCommerce store.
3. Profitability Analytics
↑ Back to top3.1 Overview
↑ Back to topThe Analytics & Reports module is designed to give you a complete, real-time view of your store’s financial performance. It consolidates critical data such as revenue, costs, profit, and margins into a unified system, allowing you to monitor business health with precision.
By combining visual dashboards with detailed reporting, the module enables data-driven decision-making. Whether you are tracking growth trends, identifying inefficiencies, or optimizing pricing strategies, the analytics system provides clear and actionable insights without requiring complex calculations or external tools.
3.2 Accessing the Dashboard
↑ Back to topAccessing analytics is simple and centralized within the WordPress dashboard.
To view the full analytics interface, navigate to:
WooCommerce → NeuralCommerce → Dashboard
This opens the Advanced Dashboard, which provides comprehensive insights into your store’s performance, including detailed charts, trends, and breakdowns.
For a more streamlined experience, you can use the simplified version:
WP Dashboard → NeuralCommerce → Simple Dashboard
This version is designed for quick access to key information without the need for in-depth analysis.
3.3 Key Metrics
↑ Back to topThe dashboard presents essential business metrics that reflect the overall performance of your store. These include:
- Total Revenue – the total value of all sales generated
- Total Cost – the cumulative cost associated with products sold
- Net Profit – calculated as revenue minus total cost
- Profit Margin (%) – an indicator of overall profitability
- Orders & Sales Trends – patterns in order volume and sales over time
All metrics are dynamically updated based on live store data, ensuring that the information you see is always accurate and current.
3.4 Visual Reports
↑ Back to topTo enhance understanding and interpretation, the module includes a variety of graphical reports. These visualizations help translate complex data into easily digestible insights, such as:
- Revenue trends across selected time periods
- Profit and margin fluctuations
- Cost distribution across products or categories
- Comparative performance of different products
These charts make it easier to identify growth patterns, seasonal variations, and potential problem areas quickly and effectively.
3.5 Product-Level Insights
↑ Back to topBeyond overall store performance, the system allows detailed analysis at the product level. This includes:
- Profit generated by individual products
- Margin percentage for each item
- Identification of best-performing products
- Detection of loss-making or low-margin products
These insights are critical for making informed decisions regarding pricing, promotions, and inventory management, helping you focus on high-performing products while addressing underperforming ones.
3.6 Date Range & Filters
↑ Back to topThe analytics system includes flexible filtering options that allow you to customize reports based on specific needs. You can:
- Select custom date ranges
- Filter data by individual products or categories
- Analyze performance for specific campaigns or seasonal periods
This level of control enables precise tracking and comparison, making it easier to evaluate the impact of business decisions over time.
3.7 AI Insights (if enabled)
When enabled, the system provides AI-driven insights to further enhance decision-making. These may include:
- Suggestions for improving profitability
- Pricing optimization recommendations
- Identification of underperforming products
- Forecasting of future trends based on historical data
These automated insights reduce manual analysis and help you take proactive steps to improve overall store performance.
3.8 Simple Dashboard
↑ Back to topThe Simple Dashboard is designed for users who prefer a quick and clean overview of store performance. It provides:
- Key metrics displayed in a concise format
- Minimal charts for quick interpretation
- A clean and easy-to-read interface
This makes it ideal for daily monitoring, allowing you to stay informed without navigating through detailed reports.
3.9 Exporting Reports
↑ Back to topThe module supports exporting analytics data for external use and reporting purposes. You can:
- Download reports in formats such as CSV
- Use exported data for accounting or advanced analysis
- Share reports with team members or stakeholders
This ensures that your data can be easily integrated into other business processes or tools.
3.10 Best Practices
↑ Back to topTo get the most value from the Analytics & Reports module:
- Review the dashboard regularly to stay updated on performance
- Focus on profit and margin, not just revenue
- Identify and take action on low-margin or loss-making products
- Use date filters to analyze performance changes over time
- Act on insights and trends to continuously improve profitability
Consistent use of these practices will help you maintain strong financial control and make informed strategic decisions for your WooCommerce store.
4. Margin Alert System
↑ Back to top4.1 Overview
↑ Back to topThe Alerts & Automation module is designed to help you continuously monitor your store’s profitability and respond proactively to critical financial changes. Instead of manually tracking performance, this system allows you to define specific conditions under which alerts are triggered, ensuring that important issues such as declining margins or loss-making products do not go unnoticed.
By combining real-time monitoring with automated rule-based actions, the module enhances operational efficiency and supports timely, data-driven decision-making.
4.2 Accessing Alert Settings
↑ Back to topConfiguring alerts is simple and centralized within the plugin settings.
To access alert configuration:
WooCommerce → NeuralCommerce → Settings → Alerts
This section provides all the necessary controls to define alert rules, set thresholds, and manage notification preferences according to your business requirements.
4.3 Types of Alerts
↑ Back to topThe system supports multiple alert types to cover key aspects of profitability monitoring:
- Low Margin Alert
Triggered when a product’s margin falls below a predefined percentage, helping you identify items that may require pricing or cost adjustments. - Loss Alert
Activated when a product is being sold at a loss, enabling immediate corrective action to prevent financial leakage. - Profit Threshold Alert
Triggered when profit rises above or drops below a specified value, allowing you to monitor both high-performing and underperforming scenarios.
These alert types ensure comprehensive coverage of different profitability conditions within your store.
4.4 Setting Alert Conditions
↑ Back to topEach alert can be customized with precise conditions to match your business logic. You can define:
- Threshold values (such as minimum margin percentage or profit limits)
- Specific products or categories to which the alert applies
- Trigger conditions that determine when the alert should activate
This level of customization allows you to fine-tune alerts, ensuring they are relevant and actionable rather than excessive or unnecessary.
4.5 Notifications
↑ Back to topOnce an alert is triggered, the system ensures you are promptly informed through multiple notification channels:
- Dashboard Notifications – visible within the admin panel for immediate review
- Email Alerts (if enabled) – sent directly to your inbox for off-dashboard awareness
These notification mechanisms ensure that you remain informed even when you are not actively monitoring the dashboard.
4.6 Automation Rules
↑ Back to topThe automation component works alongside alerts to reduce manual effort and improve responsiveness. The system can:
- Continuously monitor product performance in the background
- Automatically trigger alerts when predefined conditions are met
- Eliminate the need for constant manual checking of metrics
This automated workflow ensures consistent monitoring and timely identification of issues without additional workload.
4.7 Managing Alerts
↑ Back to topThe module provides full control over how alerts are handled and maintained. You can:
- Enable or disable specific alerts as needed
- Modify threshold values at any time based on changing business conditions
- Review previously triggered alerts directly from the dashboard
This flexibility allows you to adapt the alert system as your store evolves.
4.8 Best Practices
↑ Back to topTo maximize the effectiveness of Alerts & Automation:
- Set realistic and meaningful margin thresholds
- Enable loss alerts across all products to prevent unnoticed losses
- Regularly review triggered alerts to identify patterns or recurring issues
- Combine alert data with analytics insights for more informed decisions
Following these practices ensures that the alert system remains relevant, actionable, and aligned with your overall profitability goals.
5. Customer Lifetime Value (CLV)
↑ Back to top5.1 Overview
↑ Back to topCustomer Lifetime Value (CLV) is a critical metric that helps you understand the total financial value a customer contributes to your business over their entire relationship with your store. Unlike basic revenue metrics, CLV combines both past purchasing behavior and future projections to provide a more complete picture of customer worth.
This insight enables more strategic decision-making in areas such as marketing investment, customer retention, and personalized engagement. By focusing on long-term value rather than one-time transactions, you can build a more sustainable and profitable business model.
5.2 Understanding CLV Calculation
↑ Back to topIn NeuralCommerce, CLV is calculated using a combination of historical data and predictive modeling. This ensures that the metric reflects not only what a customer has already contributed but also their potential future value.
The calculation is based on the following formula:
Predicted CLV = Historical Revenue + (Future Expected Orders × Average Order Value × Retention Rate)
To derive this value, the system uses several key data points:
- Total number of orders and total revenue generated by the customer
- Average Order Value (AOV)
- Purchase frequency over time
- Customer age (time since the first order)
- Recency (time since the last order)
- Retention rate, which is dynamically adjusted
Retention is not static and is intelligently modified based on customer behavior:
- It decreases when a customer becomes inactive or shows long gaps between purchases
- It increases for repeat buyers or customers with high purchase frequency
Using these inputs, the system projects customer value over a standard 36-month period, providing a forward-looking estimate of long-term contribution.
5.3 Customer Segmentation
↑ Back to topBased on CLV and behavioral patterns, customers are automatically segmented into meaningful groups. These segments typically include:
- High-value / VIP customers – frequent buyers with high overall CLV
- Loyal customers – consistent repeat purchasers with stable engagement
- At-risk customers – customers showing declining activity or engagement
- Low-value customers – minimal interaction or low purchasing frequency
This segmentation enables more focused and effective business strategies, such as targeted marketing campaigns, personalized communication, and retention initiatives tailored to each group.
5.4 CLV Dashboard Widget
↑ Back to topCLV insights are integrated directly into the main dashboard through a dedicated widget, allowing quick and easy access to customer value data.
The widget typically provides:
- A list of top customers ranked by value
- Predicted lifetime value for individual customers
- Identification of high-value segments
- Quick summaries of customer performance
This real-time visibility allows you to immediately recognize your most valuable customers and prioritize them accordingly.
5.5 Customer Tier Visibility
↑ Back to topCustomers can also be categorized into tiers based on their CLV, creating a structured way to differentiate value levels across your customer base.
- Each tier represents a specific range of customer value
- High-tier customers can be identified as VIP or priority clients
- Lower tiers highlight opportunities for growth or re-engagement
This tier-based approach is especially useful for designing loyalty programs, reward systems, and exclusive offers. It helps you allocate resources efficiently by focusing efforts where they generate the highest return.
5.6 Practical Use Cases
↑ Back to topCLV insights can be applied across multiple business functions, including:
- Determining optimal spending on customer acquisition
- Identifying and rewarding top-performing customers
- Detecting customers who are at risk of churn
- Improving long-term profitability through better retention strategies
By leveraging CLV data, you can shift your focus from short-term gains to sustainable growth.
5.7 Best Practices
↑ Back to topTo effectively utilize the CLV module:
- Regularly monitor high-value and VIP customers
- Prioritize retention strategies alongside acquisition efforts
- Use segmentation to design targeted and personalized campaigns
- Track changes in CLV over time to identify trends and opportunities
Consistent use of these practices will help you maximize customer value and strengthen long-term business performance.
6. Dead Stock Analysis
↑ Back to top6.1 Overview
↑ Back to topDead Stock Analysis is designed to help you identify products that are not generating sufficient sales or have become completely inactive over time. These products tie up capital, occupy storage space, and negatively impact overall business efficiency.
By systematically detecting slow-moving or non-performing inventory, this module enables you to take timely corrective actions. The primary goal is to minimize losses, improve inventory turnover, and ensure that your resources are allocated to products that actively contribute to revenue.
6.2 Accessing Dead Stock Analysis
↑ Back to topThe dead stock data can be accessed directly from the plugin dashboard.
Navigate to:
WooCommerce → Neural Commerce → Dead Stock
This section displays a structured table containing products that have been identified as having low or no sales activity. The interface is designed to provide a clear overview, allowing you to quickly assess which items require attention.
6.3 How Dead Stock is Identified
↑ Back to topThe system automatically evaluates product performance using multiple parameters to determine whether an item qualifies as dead or slow-moving stock. These include:
- No sales within a defined time period
- Very low sales frequency over time
- High stock levels combined with low turnover
- Long duration since the last order (recency)
By combining these factors, the system ensures accurate identification of inventory that is underperforming or stagnant.
6.4 Dead Stock Metrics
↑ Back to topFor each flagged product, the system provides detailed metrics to support quick and informed analysis. These typically include:
- Product name and SKU
- Current stock quantity
- Last sold date
- Total number of sales
- Revenue generated
- Number of days since the last sale
These data points allow you to evaluate both the historical performance and current status of each product, making it easier to decide the next course of action.
6.5 Filtering & Analysis
↑ Back to topTo enhance usability and precision, the module includes filtering options that allow you to focus on specific subsets of data. You can analyze dead stock using:
- Date range filters to assess performance over selected periods
- Stock level filters to identify overstocked items
- Sales performance filters to isolate low-performing products
These tools enable targeted analysis, helping you identify problem areas within your inventory more effectively.
6.6 Actions on Dead Stock
↑ Back to topOnce dead stock is identified, the system supports informed decision-making by enabling you to take corrective actions such as:
- Offering discounts or running promotional campaigns
- Bundling slow-moving items with fast-selling products
- Adjusting pricing strategies to improve demand
- Stopping or reducing restocking of low-performing products
- Clearing inventory through targeted sales initiatives
These actions help recover value from stagnant inventory and improve overall stock efficiency.
6.7 Business Impact
↑ Back to topEffective management of dead stock has a direct and measurable impact on business performance. It helps:
- Free up working capital that is locked in unsold inventory
- Improve cash flow by converting stagnant stock into revenue
- Optimize warehouse and storage space
- Enhance overall profitability by focusing on high-performing products
By reducing inefficiencies, the system contributes to a more streamlined and financially healthy operation.
6.8 Best Practices
↑ Back to topTo maximize the benefits of Dead Stock Analysis:
- Review dead stock reports regularly to stay updated
- Define internal thresholds for identifying inactivity
- Take timely action on non-performing products
- Combine dead stock insights with analytics data for better decision-making
Consistent monitoring and proactive management will help maintain optimal inventory levels and improve long-term business performance.
7. AI-Powered Insights
↑ Back to top7.1 Overview
↑ Back to topThe AI-Powered Insights module is designed to transform your store data into meaningful, actionable recommendations that help improve profitability and operational efficiency. By analyzing historical performance, customer behavior, and product trends, the system provides intelligent suggestions that support better decision-making across pricing, inventory, and marketing.
Rather than relying solely on manual analysis, this module leverages data-driven intelligence to highlight opportunities and risks, enabling you to respond proactively and optimize overall store performance.
7.2 Accessing AI Insights
↑ Back to topAI-driven recommendations are integrated directly into the main analytics interface for easy access.
To view insights, navigate to:
WooCommerce → Neural Commerce → Dashboard
Within the dashboard, AI insights appear alongside analytics data in the form of recommendations, alerts, and highlighted observations. This ensures that insights are always available in the context of your store’s performance metrics.
7.3 Types of AI Insights
↑ Back to topThe system generates a wide range of insights covering key aspects of your business. These include:
- Pricing Optimization
Suggests adjustments to product pricing to improve margins and competitiveness. It can identify products that may be underpriced or overpriced based on performance data. - Profit Improvement
Highlights products with low margins or losses and recommends corrective actions such as cost adjustments or pricing changes. - Product Performance Insights
Identifies top-performing products that contribute most to revenue, while also detecting underperforming or stagnant items that may require attention. - Customer Insights
Recognizes high-value customers and segments while also identifying customers who may be at risk of becoming inactive.
These insights provide a comprehensive view of both strengths and areas for improvement within your store.
7.4 Predictive Intelligence
↑ Back to topIn addition to analyzing past and current data, the AI system incorporates predictive capabilities. It can estimate:
- Future sales trends based on historical patterns
- Customer purchasing behavior and engagement likelihood
- Product demand trends over time
These predictions help you plan more effectively, whether it is adjusting inventory levels, refining pricing strategies, or preparing targeted marketing campaigns.
7.5 Real-Time Recommendations
↑ Back to topAI insights are continuously updated to reflect the latest store activity. Recommendations evolve dynamically based on:
- New orders and incoming sales data
- Changes in product costs or pricing
- Ongoing customer interactions and behavior
This real-time adaptability ensures that insights remain accurate, relevant, and immediately actionable.
7.6 Automation Support
↑ Back to topThe AI module works in conjunction with automation features to enhance efficiency and responsiveness. It can:
- Trigger alerts when critical conditions are detected
- Assist in decision-making without requiring manual data analysis
- Reduce the time and effort needed to interpret complex datasets
This integration allows you to maintain consistent monitoring and quick response to important changes.
7.7 Using AI Insights Effectively
AI-generated recommendations can be applied across multiple areas of your business. You can use them to:
- Adjust pricing strategies for better profitability
- Improve overall profit margins
- Focus efforts on high-performing products
- Retain and engage valuable customers
- Minimize losses from underperforming inventory
Applying these insights strategically helps you optimize both short-term performance and long-term growth.
7.8 Limitations
↑ Back to topWhile AI insights are powerful, they are dependent on the quality and volume of available data.
- Accuracy improves as more data is collected over time
- Limited or inconsistent data may affect the reliability of predictions
- Insights should always be interpreted alongside practical business understanding
Recognizing these limitations ensures balanced and informed decision-making.
7.9 Best Practices
↑ Back to topTo maximize the benefits of AI-Powered Insights:
- Review insights regularly to stay updated on recommendations
- Prioritize actions based on highest potential impact
- Combine AI insights with analytics data for deeper understanding
- Continuously refine pricing and cost strategies based on recommendations
Consistent use of these practices will help you fully leverage AI capabilities and drive sustained improvements in your store’s performance.
8. Troubleshooting & FAQs
↑ Back to top8.1 Overview
↑ Back to topThis section is designed to help you quickly identify and resolve common issues encountered while using the plugin. It covers key areas such as installation, cost management, analytics, AI features, and alerts. In addition to troubleshooting guidance, it also answers frequently asked questions to clarify common doubts and ensure smooth operation of the system.
By following the recommendations in this section, most issues can be resolved without requiring technical intervention.
8.2 Common Issues & Solutions
↑ Back to topPlugin Not Working After Activation
If the plugin does not function correctly after activation:
- Ensure that WooCommerce is installed and activated
- Verify that your server is running PHP version 7.4 or higher
- Clear your browser and site cache, then reload the dashboard
Product Costs Not Showing
If product cost data is not visible:
- Navigate to NeuralCommerce → Product Costs
- Confirm that products exist in your WooCommerce store
- Refresh the page or re-save a product
- Ensure that cost values have been entered for the products
Profit or Margin Incorrect
If profit or margin calculations appear inaccurate:
- Verify that all cost components have been entered correctly
- Check whether taxes, shipping, or fees are included or excluded as intended
- Review configuration under NeuralCommerce → Settings
Dashboard Data Not Updating
If analytics data is not reflecting recent activity:
- Refresh the dashboard page
- Ensure that recent orders are being recorded properly
- Temporarily disable caching (if enabled)
- Check for conflicts with other plugins
AI Insights Not Appearing
If AI-driven insights are missing:
- Confirm that the AI feature is enabled under Settings → AI Settings
- Verify that the API key (if required) is correctly configured
- Ensure that sufficient store data is available for analysis
- Allow time for processing after new store activity
Alerts Not Triggering
If alerts are not being generated:
- Check alert thresholds under Settings → Alerts
- Ensure that alerts are enabled
- Verify email notification settings
- Confirm that products meet the defined trigger conditions
8.3 Performance Issues
If you experience slow performance while using the plugin, consider the following optimizations:
- Reduce the data range displayed in the dashboard
- Enable performance or caching settings where available
- Avoid running large bulk operations simultaneously
- Check server resources such as memory and CPU availability
These steps can help improve responsiveness and overall system efficiency.
8.4 Compatibility
↑ Back to topThe plugin is designed to work with standard WooCommerce installations and is compatible with most modern themes. However, conflicts may arise in certain situations:
- Use of heavily customized or outdated plugins
- Non-standard WooCommerce implementations
If compatibility issues occur:
- Temporarily disable other plugins to identify conflicts
- Switch to a default WordPress theme for testing
This process helps isolate and resolve compatibility-related problems.
8.5 Frequently Asked Questions
↑ Back to topQ. Will customers see cost or profit data?
No, all cost and profit information is strictly restricted to the admin dashboard and is never visible to customers.
Q. Can I bulk update product costs?
Yes, the Product Costs page allows efficient bulk management of cost data across multiple products.
Q. Does the plugin support variable products?
Yes, cost management is supported and can be handled based on the product structure.
Q. Why are some products showing zero profit?
This may occur if:
- The cost is equal to or higher than the selling price
- Cost values are missing or incorrectly entered
Q. How accurate are AI insights?
AI insights are data-driven and improve as more data becomes available. However, they should always be used alongside practical business judgment.
8.6 Getting Support
↑ Back to topIf issues persist after following the troubleshooting steps:
- Refer to the plugin documentation for additional guidance
- Contact support with the following details:
- Clear description of the issue
- Relevant screenshots
- System and environment information
Providing complete information helps in faster and more accurate resolution.
8.7 Best Practices
↑ Back to topTo ensure smooth operation and avoid common issues:
- Keep the plugin updated to the latest version
- Regularly review product costs and system settings
- Monitor dashboard insights and alerts consistently
- Test major changes before applying them across your store
Following these practices will help maintain stability, accuracy, and optimal performance of the plugin over time.
FAQs
↑ Back to topHelp customers by answering commonly asked questions.
Q. Does the plugin affect my store performance?
The plugin is optimized for performance and runs efficiently in the background. However, performance may depend on server resources, number of products, and data volume. Using caching and limiting large data ranges can help maintain optimal speed.
Q. Can I use the plugin with large product catalogs?
Yes, the plugin is designed to handle large catalogs. Features like bulk cost management, filtering, and centralized dashboards make it suitable for stores with a high number of products.
Q. Are historical data and reports retained after updates?
Yes, all historical data including costs, analytics, and reports are محفوظ and remain intact after plugin updates, as long as the database is not altered externally.