
Pricing Analyser helps WooCommerce store owners make smarter pricing decisions based on real performance data. It combines beautiful charts with actionable recommendations to reduce guesswork and protect margins.
Plus – keep on top of things with the daily briefing email, generated overnight by your store and full of actionable pricing recommendations to get the day off to the best start.
Installation
↑ Back to topTo start using a product from WooCommerce.com, you can use the “Add to store” functionality on the order confirmation page or the My subscriptions section in your account.
- Navigate to My subscriptions.
- Find the Add to store button next to the product you’re planning to install.
- Follow the instructions on the screen, and the product will be automatically added to your store.
Alternative options and more information at:
Managing WooCommerce.com subscriptions.
Setup and Configuration
↑ Back to topGetting started
↑ Back to topThis guide walks you through the fastest way to get Pricing Analyser working in a useful, practical way.
The aim is not to configure everything at once. It is to get the plugin set up, create a small number of sensible rules, and start reviewing recommendations with confidence.
Step 1: Enable boundary pricing if required
Go to WooCommerce → Settings → Pricing Analyser.
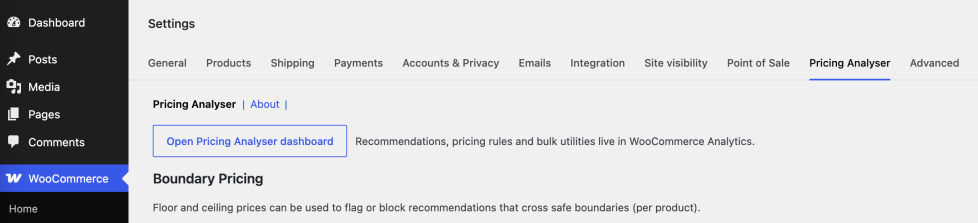
Decide if you wish to use floor and ceiling prices. Floor and ceiling prices are especially handy if you want to protect margins or avoid accidental overpricing. If you also want pricing recommendations to stay above the product’s floor price, enable ‘Block reductions below floor’ as well. Likewise if you don’t want recommendations to take prices over a set per-product ceiling then enable ‘Block increases above ceiling’.
Enable ‘Use floor prices to calculate margins’ if you want to see margin estimates in the daily briefing and show margin % in recommendations.
If you decide to enable boundary pricing on some products then you’ll also need to set your floor and/or ceilings on those products. You can do this:
- on the product edit screen, in the Pricing Analyser panel
- or in bulk using the Bulk Utilities tools
Step 2: Create a small number of pricing rules
Go to the Pricing Rules section of Pricing Analyser.
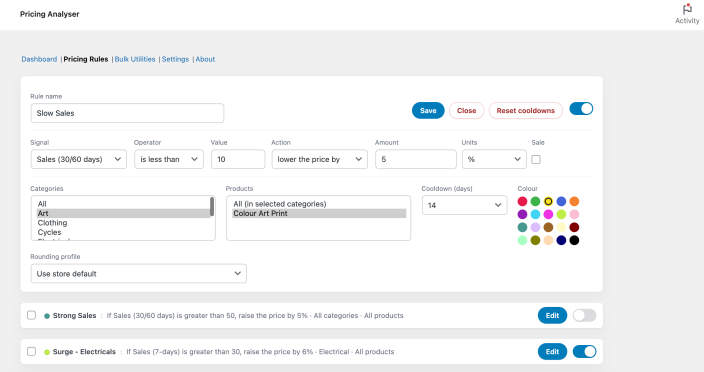
You’ll see some default pricing rules – we suggest you study them, and then delete them so you start with a clean sheet tailored to your store.
Initially, create two or three simple rules. For example:
- if sales are strong, raise the price slightly
- if conversion rate is weak, reduce the price
- if stock is low, raise the price
- if recent sales are falling, reduce the price
Avoid creating too many rules at once. A small number of clear rules is much easier to review and tune. Scope your rules to the categories or products they apply to, to keep recommendations focused.
Step 3: Open the dashboard
Go to WooCommerce → Analytics → Pricing Analyser.
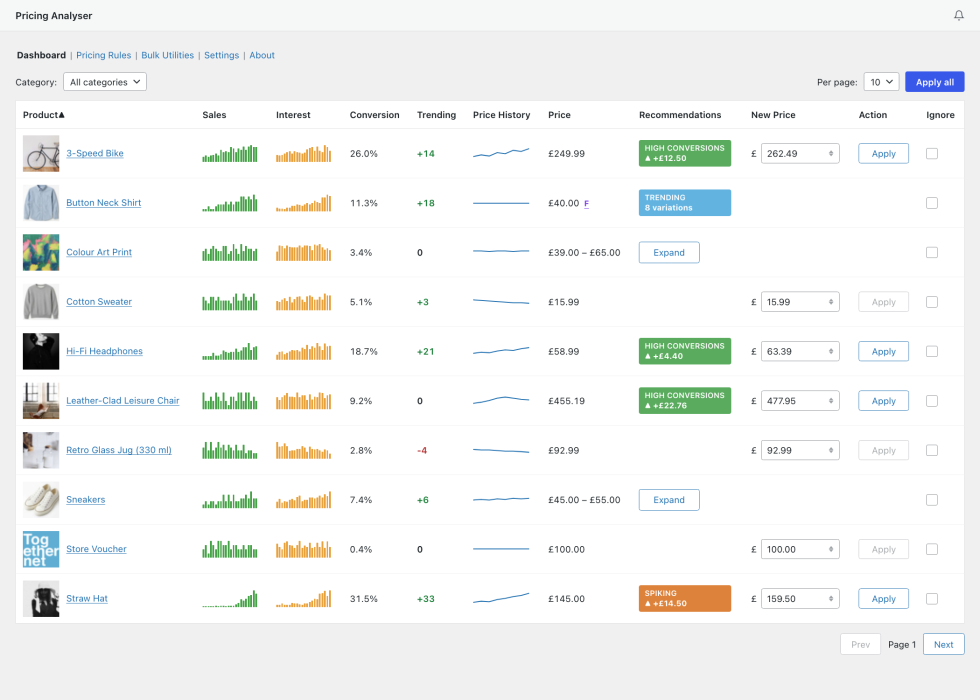
Use the category filter if you want to focus on one part of the catalogue first. Your selection here will be retained until you change it.
The dashboard is covered in detail in the Usage section, but Interest needs a little explanation. You can basically think of it as product views, but with filtering applied to reduce distortions. For products with variations, Interest is always measured at the product parent level, not at the variation level. Treat it as a general indicator of customer interest in a given product, not as an exact metric.
Step 4: Review recommendations
Look at the coloured recommendation chips in the dashboard.
For any product with a recommendation:
- Click on the coloured chip to open the explanation and see why the rule matched
- inspect the charts if needed
- decide whether to apply the suggested new price
If more than one rule matches a product, you’ll see a count of the number of matched rules (e.g. +2 indicates three matched rules in total). Pricing Analyser highlights the strongest recommendation (measured by the magnitude of the price change). You can inspect the alternatives from the explanation view and swap the active recommendation for any of the others if you so decide.
Don’t expect to see lots of recommendations straightaway. The majority of signals that drive the recommendations require many days of data (up to 60) to trigger a recommendation. An exception is the Sales (24h) signal that uses the most recent 24-hour sales window.
Step 5: Apply a change
The New Price column is populated with the recommended new price. You can apply a recommended change directly from the dashboard via each row’s ‘Apply’ button or by using the ‘Apply All’ button.
You can apply changes one by one at first. Once you are comfortable with the recommendations, you can use bulk actions more confidently. If you decide to use the ‘Apply All’ button, you can filter out individual recommendations using the Ignore toggle at the end of each row. Don’t worry, even if there are many pages of products, only the currently visible recommendations will be applied.
You can also adjust any recommendation before applying it by making a change to the New Price field.
Remember, Pricing Analyser does not autonomously change prices. You must approve or reject the proposed price changes presented on the dashboard.
Step 6: Enable the daily briefing
Back in WooCommerce → Settings → Pricing Analyser, enable the daily briefing email and configure:
- recipients
- briefing generation time
- delivery time
- any category focus you want to apply
The daily briefing is useful once rules are active and pricing recommendations are being generated regularly.
Recommended starting approach
For the best early results:
- start with a few simple rules
- use boundaries on products where margin protection matters
- review recommendations manually before selecting ‘Apply All’
- let the daily briefing highlight exceptions and changes worth reviewing
- be patient – Pricing Analyser needs time to gather data.
Usage
↑ Back to topDashboard
↑ Back to topThe Pricing Analyser dashboard is the main working area of the plugin. It brings together product-level pricing signals, charts and recommendations so that you can review your catalogue and act on pricing opportunities in one place.
For most merchants, this is the screen they will return to most often.
Go to WooCommerce → Analytics → Pricing Analyser.
What the dashboard is for
The dashboard is designed to help you answer practical pricing questions such as:
- Which products may now justify a price rise?
- Which products may need a price reduction?
- Which products are attracting interest but not converting?
- Which products are trending strongly up or down?
- Which products are close to margin limits or pricing boundaries?
- Which recommendations are worth acting on now?
Rather than looking at separate reports and then updating products manually, you can review the relevant data and apply changes directly from the dashboard.
What the dashboard shows
Each row in the dashboard represents a product, and may include:
- product image and name – click to edit the product directly
- sales sparkline – click to open a more detailed sales chart
- interest sparkline – click to open a more detailed interest chart
- conversion rate
- trending score
- price history sparkline – click to open a more detailed price history chart
- margin percentage, where available
- current price
- recommendation chip
- suggested new price
- action button
- ignore option
Together, these give you a practical summary of recent product performance and the pricing action currently being suggested.
Most columns are sortable by clicking on the row headers.
Sales and Interest
The sales and interest columns show compact sparkline charts.
These help you quickly identify products that are:
- selling steadily
- accelerating
- slowing down
- attracting attention
- losing interest
You can click these charts to open a larger view and inspect the underlying pattern more closely.
Conversion
The conversion column shows the current conversion rate for the product.
This helps identify products that are receiving interest but not converting as strongly as expected. In practice, conversion is often most useful when read together with interest and sales rather than on its own.
Trending
The trending column shows a score from ‘-9’ to ‘+9’.
A positive score means the product’s recent sales are stronger than its earlier baseline. A negative score means recent sales are weaker than the earlier baseline. A score near zero means the recent pattern is broadly in line with what came before.
Trending is intended as a clear directional signal rather than a raw sales metric.
Price History
The price history sparkline shows how the product’s price has moved over time. Click the sparkline to view the same data in more detail.
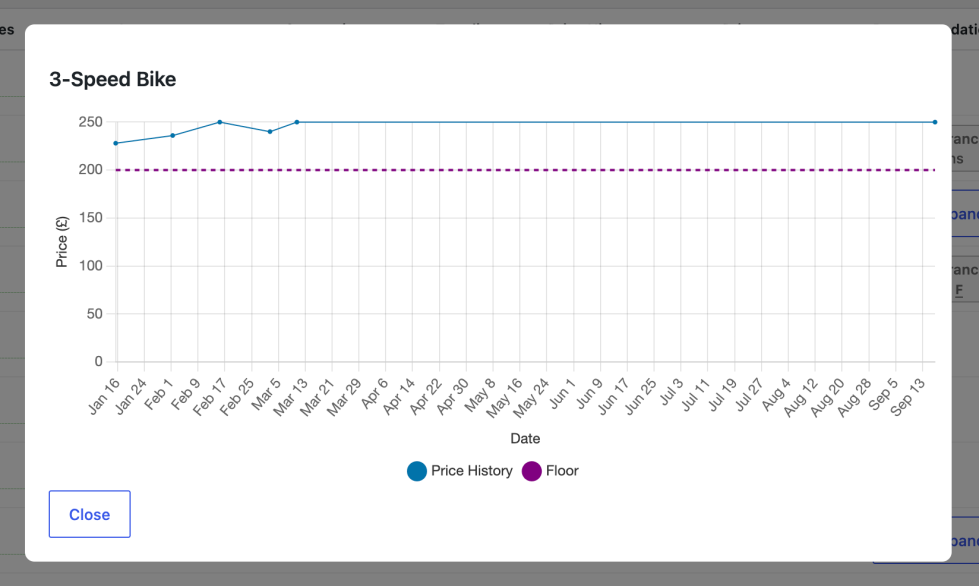
This is helpful when reviewing a recommendation because it shows whether the current price sits within a stable range or follows recent manual changes, sales or rule-based adjustments.
For variable products, the history view can reflect variation-level history where relevant.
Clicking the sparkline opens a detailed price history chart showing up to 30 price changes. The time period is not related to the sales & interest history window; it covers the interval when these price changes were implemented.
Margin
When margin display is enabled and a floor price is available, the dashboard can show a margin percentage.
This gives a quick indication of how much headroom exists between the current selling price and the floor price being used as a proxy for cost.
Margin visibility is particularly useful when reviewing reductions, sale recommendations and products that are drifting too close to the floor.
Current Price
The price column shows the current product price.
If a product is already on sale, the dashboard can show both the regular price and the sale price.
Boundary markers may also appear here to indicate floor or ceiling context. An underlined F indicates a price at or below the floor; similarly a C with an overline indicates a price at or above its ceiling.
This helps you understand the pricing state of the product before applying any recommendation.
Recommendation Chips

The recommendation chip is the most important output on the dashboard.
It shows:
- the matched rule
- the direction and size of the suggested price change
- whether the action would create a sale
- whether boundary conditions are relevant
- whether a recommendation is inactive or blocked
In the screenshot, the red chip indicates a rule has matched with Hi-fi Headphones, recommending a clearance price reduction due to very low sales. You can click the chip to open a detailed explanation of why the recommendation matched.
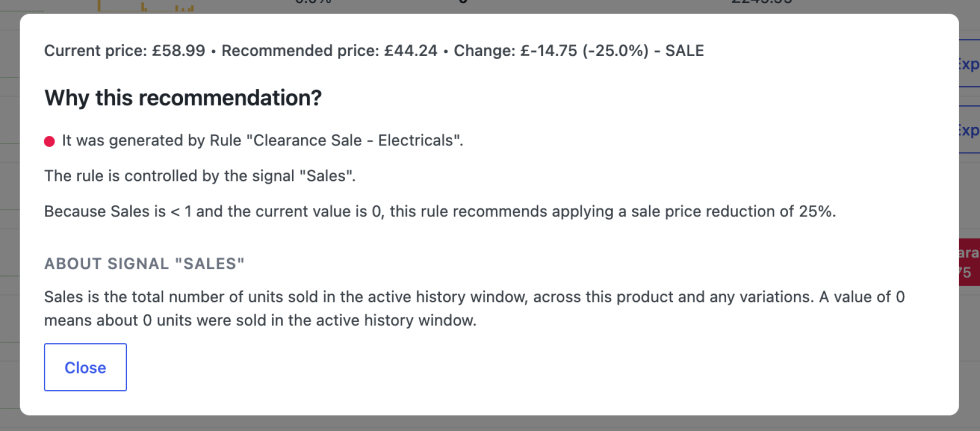
Some products may match more than one rule. In those cases, Pricing Analyser highlights the strongest recommendation while still allowing you to inspect other matched rules. Click on the chip to see all recommendations. Here you’ll also have the option to swap to one of the other recommendations.
Suggested New Price and Apply
The dashboard also shows the suggested new price, which you can edit before applying if needed.
From the same row, you can:
- apply the suggestion directly
- adjust the suggested value manually first
- ignore the product if you do not want it considered
This makes the dashboard both a review screen and an action screen.
Variable products
Variable products are handled carefully depending on how their pricing is structured.
Where variation-level treatment is needed, the product row can be expanded to reveal individual variations and their own pricing history, recommendation chips and actions.
This allows merchants to work at the right level of detail without overcrowding the main dashboard view.
Filters and controls
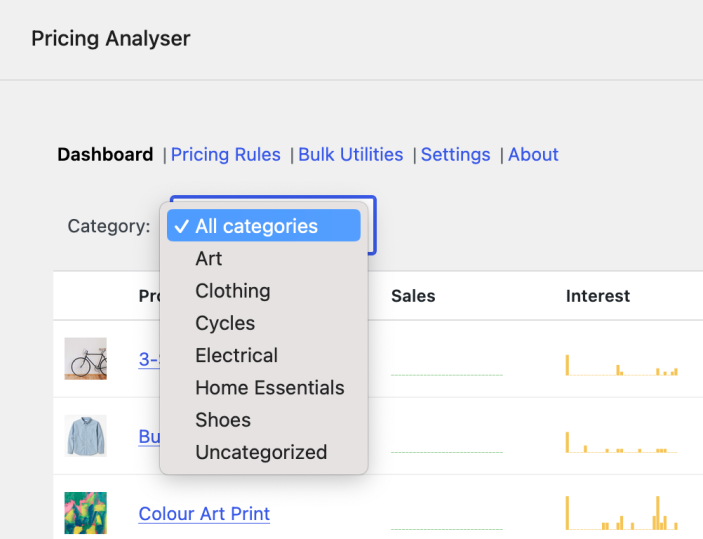
The dashboard includes controls to help you manage large catalogues, including:
- category filtering
- per-page display controls
- pagination
- apply-all support where appropriate
These controls make it easier to focus on one category or product group at a time.
Expanded Sales, Interest and Price History Charts
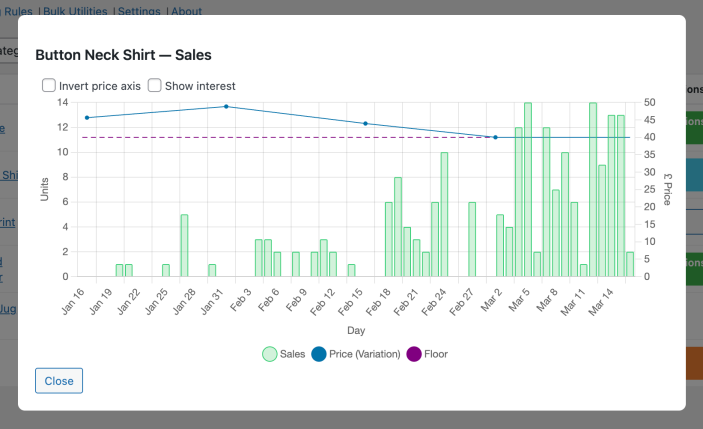
Click on any sparkline chart to open a more detailed view. For Sales and Interest, you can inspect data for the current window (either 30 or 60 days), overlayed with any relevant price history. You can invert the price history y-axis to make it easier to spot any correlation between the price changes and sales or interest. You might expect sales to follow the price trend after a small delay. If this is not the case, this indicates a lack of price sensitivity for a given product. That offers an opportunity to increase the price without detriment. On the other hand a close correlation suggests an opportunity to increase turnover with a small price reduction.
How to use the dashboard effectively
A practical approach is:
- filter to a category if needed
- look for recommendation chips first
- review the supporting sparklines and trend/conversion values
- open the explanation for any recommendation you may want to apply
- apply individually at first, then use broader actions once you are comfortable
The dashboard works best when used regularly, with a relatively small set of well-considered pricing rules.
Product edit screen
↑ Back to topPricing Analyser adds its own panel to the WooCommerce product editing interface. This gives you access to product-level pricing information without leaving the product page.
The panel is designed to support product-specific review and setup. It brings together price history, sales and interest charts, boundary settings and quick links into the wider Pricing Analyser workflow.
Within the product data area, you will see a Pricing Analyser section. This is where Pricing Analyser adds its own product-level controls and charts.
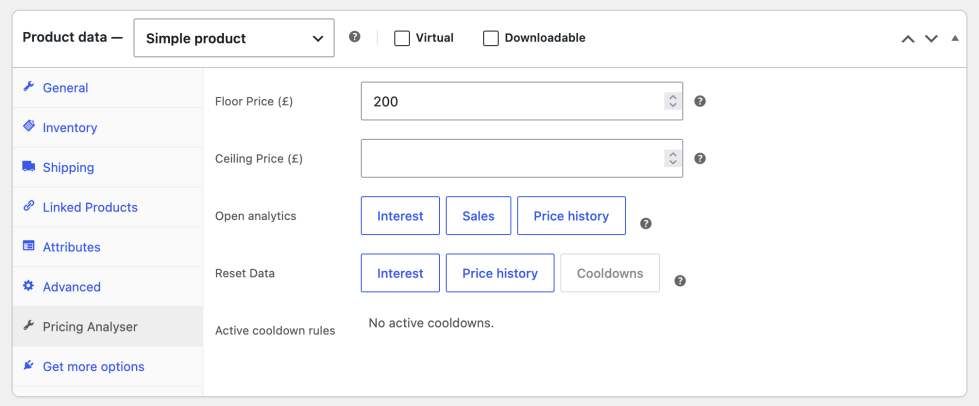
What the Pricing Analyser panel shows
The panel gives you access to:
- floor price
- ceiling price
- price history tracking mode (variable products only)
- quick links into the Pricing Analyser analytics views
- product-specific reset options for Pricing Analyser data
This allows you to review a product’s pricing context directly while editing it.
Floor and ceiling prices
If boundary pricing is enabled, the panel allows you to set:
- a floor price
- a ceiling price.
These values define the price range you consider commercially acceptable for that product.
They can be used to:
- protect margin
- prevent excessive price reductions
- limit aggressive price increases
- support more controlled recommendation behaviour.
If you use floor prices as a proxy for product cost, Pricing Analyser can also use them in margin calculations.
Price History Tracking
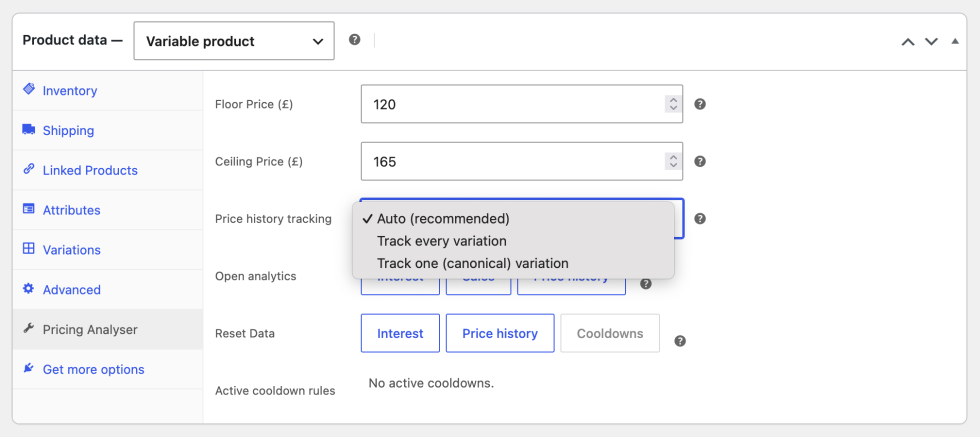
For variable products, this setting controls how Pricing Analyser records and displays price history. In practical terms, it determines whether the product is treated as having one representative price history or whether variation histories are tracked individually.
If the variations are usually priced the same, a single representative history will often be the simplest option. If variations differ meaningfully in price and need to be analysed separately, variation-level tracking is usually more useful. For example, if you sell photo prints then you may choose to sell them framed or unframed, and you’d definitely want to charge different amounts for these variations. So you’d select ‘Track every variation’ in Price History Tracking. On the other hand, if you sell items that vary only by colour, you may decide to price them all the same. You might therefore select ‘Track one (canonical) variation. Finally, if you found you had a lot of items left of one colour, then you might want to drop the price of that colour to clear stock. By selecting the Auto option, then as soon as you create different prices among the variations, Pricing Analyser will track all of the variations separately.
Open Analytics buttons
The panel includes quick links that open the relevant Pricing Analyser analytics views.
These are useful when you want to move from product editing into a wider review of:
- sales
- price history
- interest.
This makes it easier to inspect the same product within the main Pricing Analyser dashboard and charts.
Reset Data actions
The panel also includes reset tools for Pricing Analyser-specific data.
These actions operate on Pricing Analyser data only. They do not remove normal WooCommerce product records or order data.
Sales history cannot be reset as it is taken from WooCommerce product records.
Cooldowns are rules that have been recently applied to the product and are within the cooldown period assigned to the rule, so cannot yet be reapplied. Any active cooldowns are listed. Cooldowns will be removed on expiry but you can remove them here if you want to do so earlier.
Supported product types
Pricing Analyser is designed primarily for:
- simple products
- variable products.
Unsupported product types are excluded from the Pricing Analyser workflow where recommendations would not make sense.
For variable products, Pricing Analyser can work at variation level where appropriate.
How this page fits into the workflow
The product edit screen is best used when:
- reviewing one product in detail
- setting or adjusting floor and ceiling prices
- checking recent price history before changing a price
- reviewing and resetting cooldowns if needed.
For broader pricing review and action across the catalogue, the main Pricing Analyser dashboard is the primary workspace.
Pricing rules
↑ Back to topPricing rules are what turn store activity into actionable recommendations. They allow you to define the conditions under which a product should be considered for a price rise, a price reduction or a sale.
Rules are built around the signals tracked by Pricing Analyser, such as sales, interest, conversion, trending and stock level. Each rule checks one signal against a condition, then recommends a pricing action when that condition is met. In practical terms, a rule says:
“If this signal meets this condition, recommend this pricing action for these products.”
E.g.
“If the Trending signal is greater than +5, increase the price by 10% across the Dining Tables category”.
Go to WooCommerce → Analytics → Pricing Analyser and open the Pricing Rules section.
This is where you can create, edit, enable, disable, export and import rules.
How a rule works
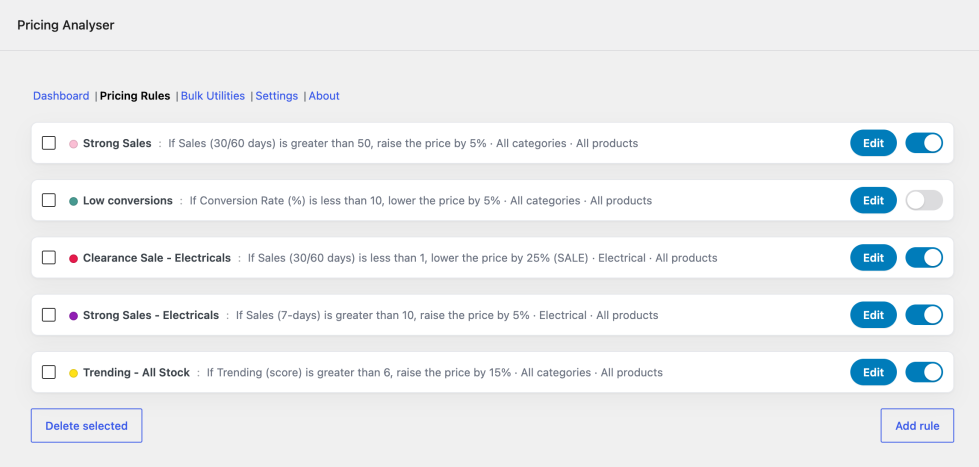
Each rule has four main parts:
- a name
- a condition
- an action
- a scope
Rule condition
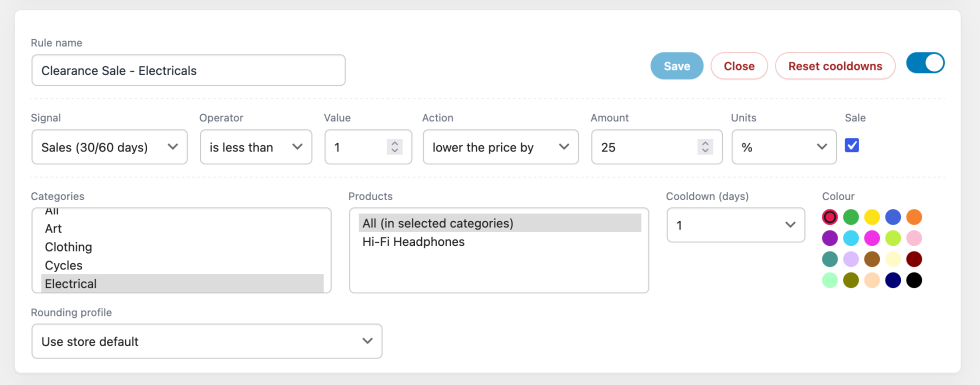
The condition defines when the rule should match.
A condition includes:
- the signal to evaluate
- the operator, such as greater than, less than or equal to
- the threshold value
For example:
- If Sales (7d) is greater than 20
- If Conversion Rate (%) is less than 5
- If Trending is greater than 4
- If Stock level is greater than 30
The available signals are described in detail in the Signals Reference section.
Rule action
The action defines what Pricing Analyser should recommend when the condition is met.
Available action types include:
- raise the price
- lower the price
- create or apply a sale when reducing the price
Actions can be based on:
- a percentage change
- a fixed amount
- an absolute target price, where supported
For example:
- raise the price by 5%
- lower the price by £2
- reduce the price by 10% and apply it as a sale price
Rule scope
The scope determines which products the rule applies to.
A rule can be limited to:
- all products
- selected categories
- selected products
This lets you create broad catalogue rules or highly targeted rules for a specific area of the store.
Cooldowns
Rules can include a cooldown period. This prevents the same rule from repeatedly recommending changes for the same product immediately after a price has already been adjusted.
Cooldowns are useful because they:
- reduce repeated noise in the dashboard
- give a price change time to take effect
- make recommendations easier to review
Once a rule enters cooldown for a product, that rule will not trigger further recommendations for the same product until the cooldown period has passed.
Rounding
Rules can use store-wide or rule-specific rounding behaviour so that recommended prices look commercially sensible.
Depending on your settings, Pricing Analyser can round prices using:
- fractional endings such as .99
- whole-unit steps
- no rounding
This helps produce cleaner suggested prices without having to edit every recommendation manually.
Sale-based reductions
When lowering a price, you can choose whether the reduction should be applied as a normal price change or as a sale price.
This is useful when you want a recommendation to create a promotional reduction rather than permanently change the regular price.
Where relevant, Pricing Analyser indicates on the dashboard when a recommendation would apply a sale price.
How matched rules become recommendations
When a product matches a rule, Pricing Analyser calculates the suggested new price and checks whether the recommendation is valid within the current pricing context.
This includes factors such as:
- floor and ceiling boundaries
- rounding settings
- cooldowns
- whether the product is already on sale, where relevant
A recommendation may be discarded if it would breach floor or ceiling boundaries, a current cooldown, or not create an actual price change after rounding is taken into account.
If more than one rule matches a product, Pricing Analyser highlights the strongest matched recommendation while still allowing you to inspect the other matched rules (by clicking on the coloured recommendation chip).
Example rules
Here are some typical examples of how rules can be used:
- raise the price when recent sales are unusually strong
- reduce the price when conversion rate is weak
- raise the price when stock is low
- reduce the price when a product is overstocked
- create a sale when a product is underperforming
The best rules are usually simple, easy to understand and clearly tied to a commercial objective.
Best practice
When starting out, it is usually better to create a small number of rules and refine them over time rather than trying to cover every possible case immediately.
A good starting approach is:
- begin with two or three simple rules
- review the recommendations they generate
- check the supporting charts and explanation panels
- adjust thresholds if needed
- add more rules only once the first set is behaving as expected
Signals
↑ Back to topSignals are the measurements used by Pricing Analyser to decide whether a rule should match. Each rule tests one signal against a condition such as greater than, less than or equal to a specified value.
Signals are based on product performance data already available within the store, including sales, interest, conversion, trend and stock level.
This page explains what each signal means and how it is intended to be used.
Sales (24h)
Sales (24h) measures units sold over a rolling 24-hour window.
Unlike the other sales signals, this is not tied to complete calendar days. It is designed to surface very recent movement and is the most responsive sales signal available in Pricing Analyser.
This signal is best used when you want to react quickly to a sudden burst of demand.
Typical uses include:
- raising prices when very recent sales are unusually strong
- spotting sudden short-term surges
- reacting more quickly than a calendar-day sales signal would allow
Sales (Yesterday)
Sales (Yesterday) measures units sold during the previous complete day.
This signal is simple and easy to reason about because it uses a full calendar day rather than a rolling window. It can be useful where a merchant wants explicit control over what counts as a meaningful one-day sales level.
Typical uses include:
- raising prices when yesterday’s sales were unusually strong
- reducing prices when yesterday’s sales were very weak
- building simple one-day rules without using rolling 24-hour logic
Sales (7d)
Sales (7d) measures total units sold over the last 7 complete days.
This is often a useful short-term sales signal because it smooths out the noise of a single day while still reacting to recent change.
Typical uses include:
- identifying products with strong recent demand
- identifying products with weak recent demand
- supporting simple price rise or reduction rules
Sales (30/60d)
Sales (30/60d) measures total units sold over the active sales history window.
The exact period depends on the store’s configured history window:
- 30 days if the history window is set to 30 days
- 60 days if the history window is set to 60 days
This is the broadest sales signal in Pricing Analyser and is useful when you want rules based on more established product performance rather than short-term movement.
Typical uses include:
- identifying slow long-term sellers
- identifying products with consistently strong demand
- supporting slower-moving pricing decisions
Conversion Rate (%)
Conversion Rate (%) measures the relationship between sales and interest. In practical terms, it shows how effectively product interest is turning into purchases.
Interest reflects product view activity. It is a measure of attention rather than demand. A high Interest value means a product is attracting views, but that does not necessarily mean it is converting into sales.
A low conversion rate may suggest that a product is attracting views but failing to convert strongly. A high conversion rate may suggest that the current price and offer are working well.
This signal is typically most useful when read alongside Interest and Sales rather than in isolation.
Typical uses include:
- reducing prices on products with weak conversion
- raising prices where conversion remains strong
- identifying products that may be drawing attention but not commitment
Trending
Trending is a score from -9 to +9 that compares the average daily sales of the last complete 7 days with the average daily sales of the earlier part of the available 14 to 60 day sales window.
A positive score means recent sales are stronger than the earlier baseline. A negative score means recent sales are weaker than the earlier baseline. A score near zero means recent sales are broadly in line with the earlier pattern.
This signal is intended to provide a clear directional view of recent sales movement rather than a raw volume measurement.
Typical uses include:
- raising prices on products that have recently strengthened
- reducing prices on products that have recently weakened
- spotting changes in momentum that may not be obvious from total sales alone
Stock Level
Stock Level measures the currently available stock quantity for the product or variation being evaluated.
For products that manage stock at variation level, Pricing Analyser can treat each variation separately. For products using product-level stock management, the product-level stock value is used.
This signal is often useful in conjunction with boundary pricing and margin protection.
Typical uses include:
- raising prices when stock is low
- reducing prices when stock is high
- creating sale-price reductions for overstocked items
Where supported in the rule builder, stock can also be evaluated relative to the product’s low stock threshold.
Choosing the right signal
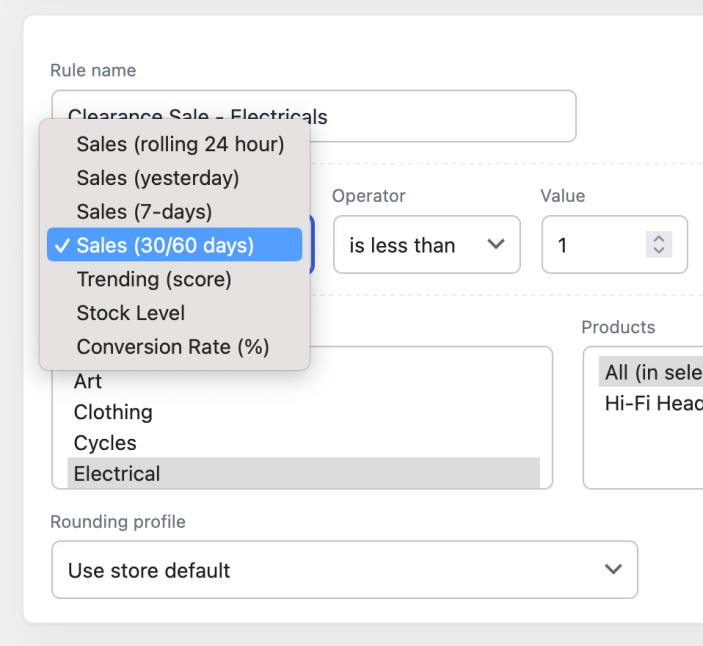
Different signals are suited to different pricing objectives.
As a rough guide:
- use Sales (24h) or Sales (Yesterday) for very recent sales behaviour
- use Sales (7d) for short-term performance
- use Sales (30/60d) for broader sales behaviour
- use Conversion Rate to assess sales efficiency
- use Trending to capture recent direction of movement
- use Stock Level when stock position should influence pricing
Using signals well
In practice, signals are most useful when combined sensibly through separate rules rather than overcomplicated logic in a single rule.
For example, a merchant might use:
- a trend rule to identify products strengthening in demand
- a conversion rule to spot hesitation
- a stock rule to protect margin when availability is limited
The strongest Pricing Analyser setups usually come from a small number of clear rules built around signals that are easy to interpret.
Bulk utilities
↑ Back to topThe Bulk Utilities tools are designed to help you make controlled pricing changes across multiple products without editing each product individually.
These tools are especially useful when you need to apply broad commercial decisions across a category, product range or the whole store.
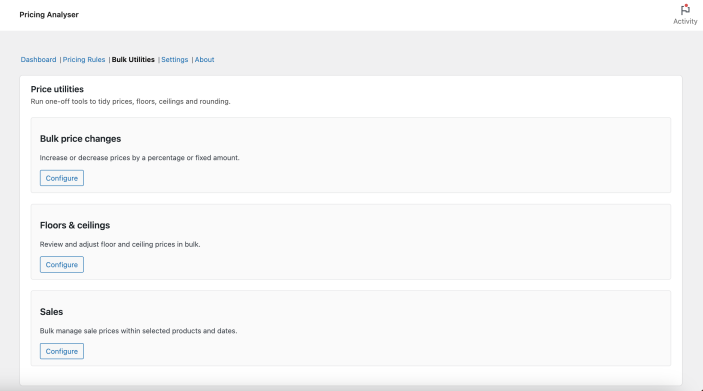
Go to WooCommerce → Analytics → Pricing Analyser and open the Bulk Utilities section.
This area contains one-off tools for working with prices, sales, floors, ceilings and rounding.
What Bulk Utilities are for
Bulk Utilities are intended for tasks such as:
- raising or lowering prices across a group of products
- creating, changing or cancelling sales in bulk
- setting or adjusting floor and ceiling prices
- applying rounding to existing prices or boundaries
- correcting products that sit outside their intended floor or ceiling range
They are operational tools rather than rule-based recommendations. In other words, they allow the merchant to make a deliberate change across a defined scope.
Bulk price changes
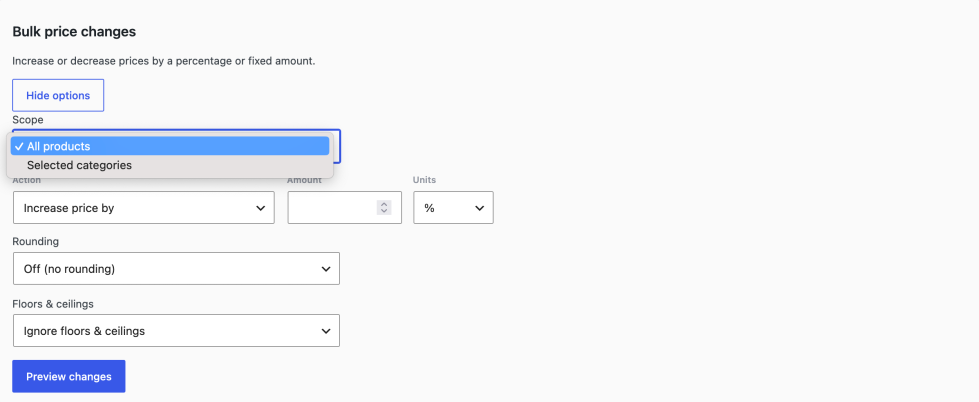
The bulk price tools allow you to increase or decrease prices using either a percentage or a fixed amount.
You can choose the scope of the change, such as:
- all products
- selected categories
- other supported filters within the utility
When making a bulk price change, you can also control how floor and ceiling pricing should be treated and whether rounding should be applied.
Typical uses for bulk price changes
- applying a store-wide seasonal price increase
- reducing prices across a slow-moving category
- making a controlled margin adjustment across a range
- cleaning up existing prices using rounding rules
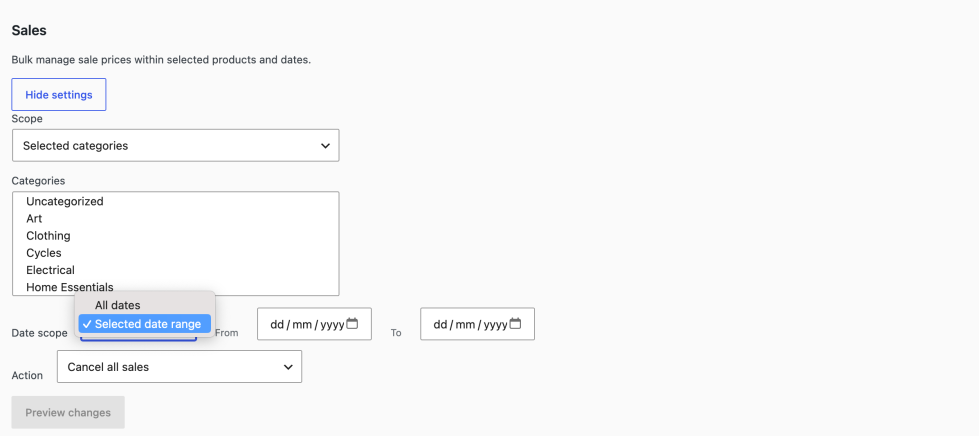
Bulk sales management
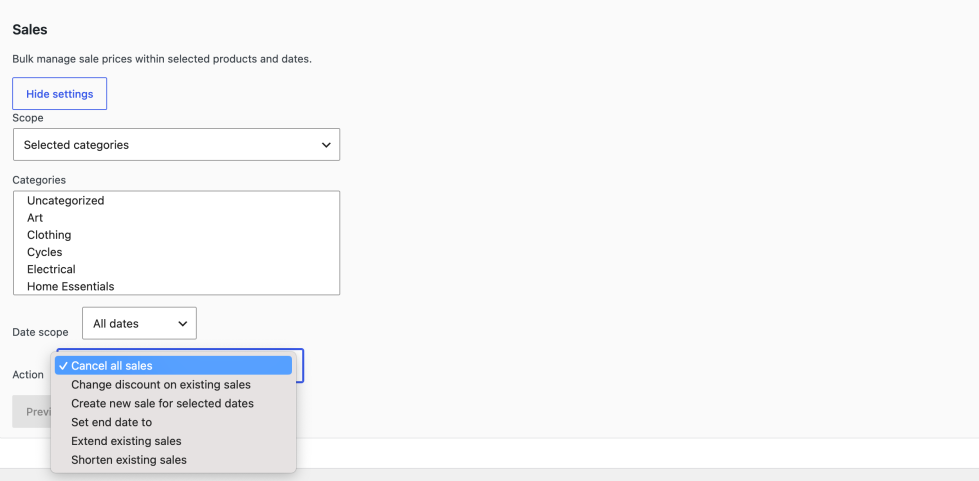
The sales utility allows you to manage sale prices across multiple products and dates.
Depending on the action selected, you can:
- cancel existing sales
- change discounts on existing sales
- create new sales for selected dates
- set end dates
- extend existing sales
- shorten existing sales
This is useful when you need to run or adjust promotional activity across a group of products without editing each one individually.
Scope and date selection
Bulk sales management supports scope selection so that you can limit changes to the part of the catalogue you actually want to affect.
This is important because promotional changes are often category-specific or date-specific rather than catalogue-wide.
Floors and ceilings
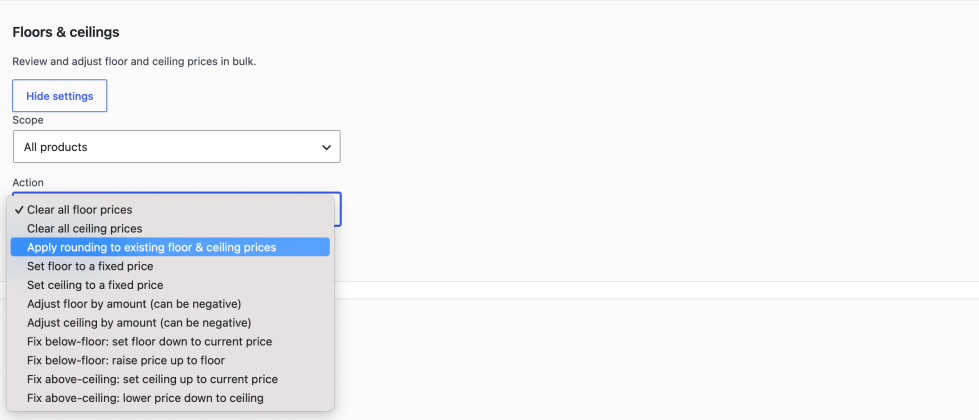
The floors and ceilings utility allows you to review and adjust product boundaries in bulk.
Typical actions include:
- clearing all floor prices
- clearing all ceiling prices
- setting floors or ceilings to a fixed value
- adjusting floors or ceilings by a fixed amount
- applying rounding to existing floors and ceilings
- fixing products that currently sit below floor or above ceiling
This is useful when setting up Pricing Analyser for the first time or refining your pricing boundaries over time.
Working with below-floor and above-ceiling products
Bulk Utilities can also help correct products that already sit outside the intended pricing range.
For example, you may choose to:
- bring the floor down to the current price
- raise the product price up to the floor
- bring the ceiling up to the current price
- lower the product price down to the ceiling
These options are useful when introducing floor and ceiling pricing to an existing catalogue.
Rounding tools
Rounding can be applied as part of bulk actions so that updated prices and boundaries remain visually clean and commercially sensible.
This is particularly useful when applying percentage-based changes that would otherwise produce awkward price endings.
Preview changes
Where available, use the preview step before applying a bulk action.
This allows you to check the effect of the action before committing it, which is especially important when working across large parts of the catalogue.
Best practice when using Bulk Utilities
Bulk tools are powerful, so they are best used carefully and deliberately.
A good working approach is:
- choose a narrow scope first
- preview the effect if a preview is available
- check how boundaries and rounding will behave
- apply the action to a controlled subset before using it more widely
This is particularly important when changing sale prices or boundary values across many products.
How Bulk Utilities differ from Pricing Rules
Pricing Rules are designed to generate product-specific recommendations based on performance data. Bulk Utilities are different: they are manual operational tools for making one-off changes across multiple products.
In practice, many merchants will use both:
- Pricing Rules for ongoing pricing guidance
- Bulk Utilities for larger planned adjustments
Typical scenarios
Bulk Utilities are especially useful for scenarios such as:
- running a category-wide promotion
- adjusting prices to reflect supplier cost changes
- setting initial floors and ceilings across an existing catalogue
- normalising price endings after manual import or editing
Daily briefing
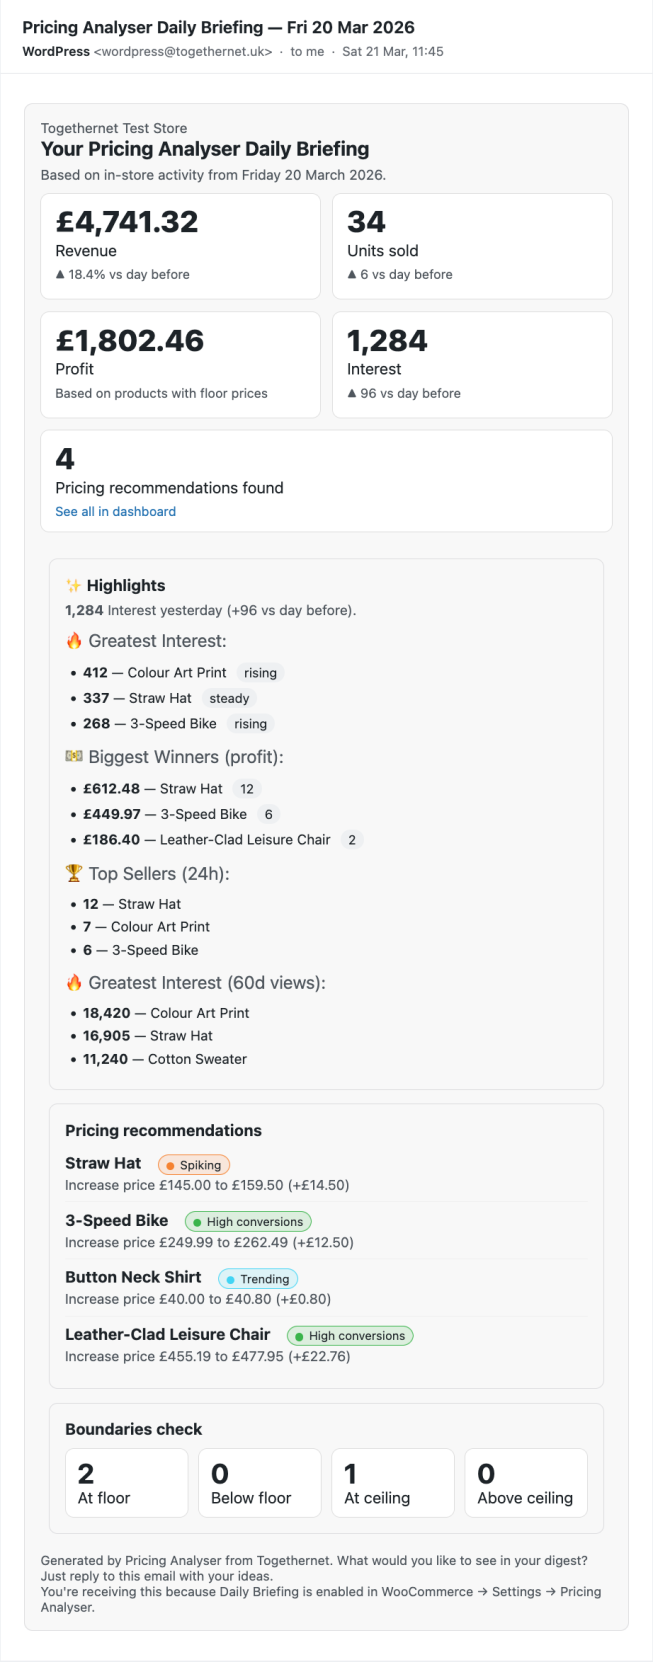
↑ Back to topThe Daily Briefing is Pricing Analyser’s overnight summary email. It is designed to give store owners a concise, practical update on recent store activity and pricing opportunities without needing to open the dashboard first.
Rather than sending a generic report, the briefing focuses on the information most useful for day-to-day pricing management.
What the Daily Briefing is for
The briefing is intended to help you:
- see how the store performed recently
- spot pricing opportunities worth reviewing
- keep track of strong and weak product performance
- stay engaged with store activity on a regular basis
For merchants who do not log into the dashboard every day, it provides a practical summary of what changed and what may need attention. In essence, the briefing helps answer the question: “What should I look at this morning?”
Go to WooCommerce → Settings → Pricing Analyser.
The Daily Briefing section allows you to configure:
- whether the email is enabled
- who receives it
- when it is generated
- when it is delivered
- which categories should be emphasised, if required
How it works
The Daily Briefing is generated overnight and then delivered later at the configured time.
This separation exists so that the store activity can be processed first and the completed email can be sent at a more useful time in the morning.
The briefing is based on in-store activity from the day just completed. Use it for suggestions on how to make today’s trading better than yesterday’s.
What the briefing includes
The exact contents may vary depending on your configuration, but the briefing can include:
- units sold
- revenue
- interest
- profit, where floor-based margin calculation is enabled
- number of pricing recommendations found
- highlight products or notable activity
- pricing recommendations
- greatest interest products
- top sellers
- biggest winners and losers, where margin calculation is available
- a boundaries check summary
The aim is to provide both a quick numeric summary and a set of practical items worth reviewing.
Greatest Interest and Top Sellers
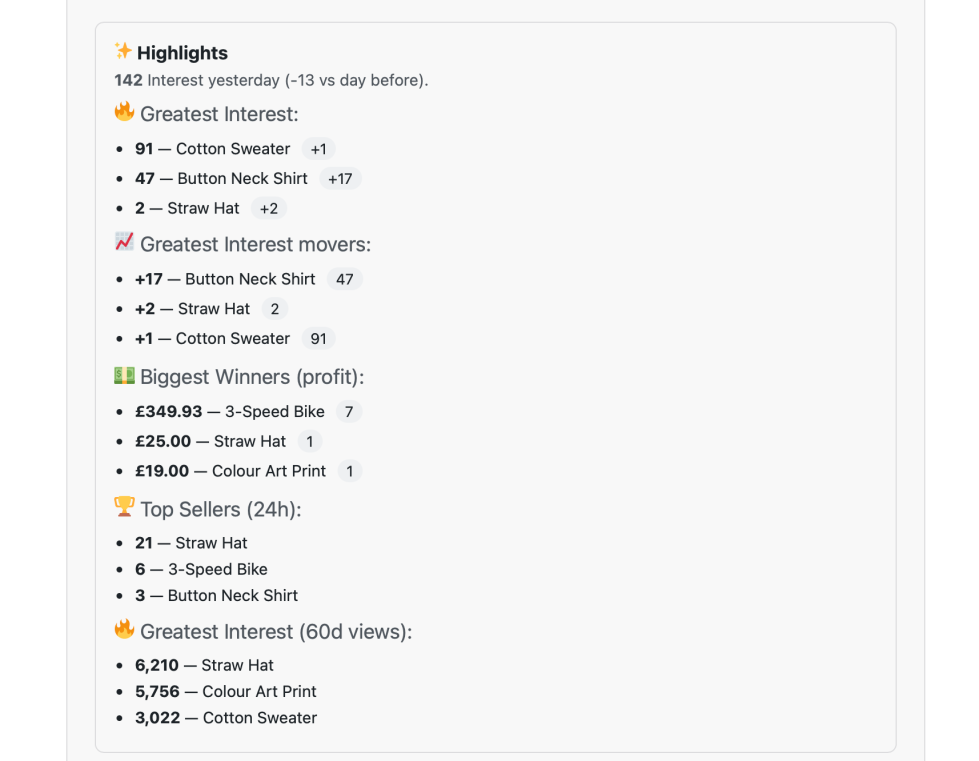
The briefing can highlight products with the strongest recent interest and products with the strongest recent sales performance.
This helps draw attention both to products attracting customer attention and to products already converting strongly.
These are often useful lists to compare. A product with strong interest but weak sales may need a different response from a product with both strong interest and strong sales.
Winners and Losers
If floor prices are being used to calculate margins, the briefing can estimate product-level winners and losers based on recent sales and the relationship between selling price and floor price.
This is intended to provide a practical margin-based summary of where value is being created or lost, using the floor price as a proxy for buy cost.
Only products with floor prices are included in these calculations.
Pricing recommendations in the briefing
The briefing can include pricing recommendations identified by Pricing Analyser’s rules engine.
These recommendations are intended to surface products worth reviewing, not to replace judgement. The dashboard remains the best place to inspect the supporting detail before applying changes.
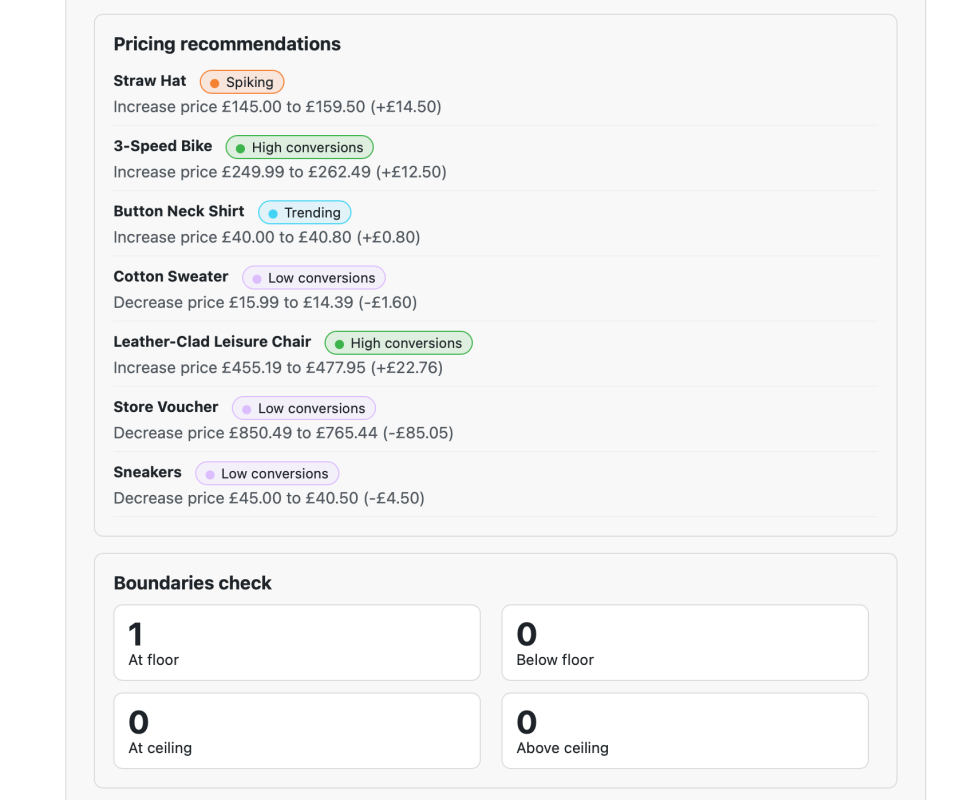
Boundaries check
The briefing can also include a simple boundaries check showing how many products are:
- at floor
- below floor
- at ceiling
- above ceiling
This is useful for keeping an eye on pricing discipline across the catalogue.
Recipients
You can send the briefing to one or more configured recipients.
This makes it suitable not only for a store owner, but also for a manager or team member responsible for pricing review.
Category focus
If needed, the briefing can be configured to focus on selected categories rather than the full catalogue.
This is useful for merchants who manage a large catalogue but want the email to remain tightly focused and readable.
Test briefing
The settings page includes a test action so that you can send the briefing immediately to the configured recipients.
This is useful when:
- checking the current layout
- reviewing the current content mix
- verifying delivery
- confirming that recipients are correct
How to use the briefing effectively
The Daily Briefing works best when it supports, rather than replaces, the dashboard workflow.
A sensible approach is:
- use the briefing to spot what changed
- use the dashboard to inspect products in detail
- apply changes from the dashboard once reviewed
In other words, the briefing is ideal for surfacing priorities, while the dashboard remains the place for detailed review and action.
Best practice
- keep the recipient list tight and relevant
- choose a delivery time that fits your working day
- enable it once rules and boundaries are meaningfully configured
- use it to highlight exceptions and opportunities, not just to review headline numbers
Practical tips
↑ Back to topA few things that tend to make the difference once rules are running:
- Read signals together, not in isolation. High interest with low conversion suggests a different issue from high sales with high conversion; strong recent sales with very low stock may justify a different response from the same sales with excess stock.
- Open the explanation before applying an unclear recommendation. It shows which rule matched, the signal value that caused the match, any other rules that also matched, and whether a boundary or cooldown applied. This becomes more useful the more active rules you have.
- Treat Trending as direction, not volume. It shows whether recent sales are stronger or weaker than the earlier baseline, and is not a substitute for total sales when judging overall strength.
- Use floor prices consistently if you want margin insight. Where floor prices represent a realistic cost baseline, margin and profit figures become much more useful. Where they are incomplete or inconsistent, that output is correspondingly less reliable.
- Expect to tune thresholds. The right values depend on your catalogue, pricing model and sales volumes, and a small adjustment after the first round of recommendations often makes a rule considerably more useful.
- Review one category at a time where catalogues are broad. Different product groups may have very different pricing behaviour, and the category filter makes recommendations easier to interpret.
Advanced settings
↑ Back to topGo to WooCommerce → Settings → Pricing Analyser. These settings control how recommendations are calculated and how pricing data is interpreted across the store. Most stores only need to revisit them occasionally.
Boundary pricing
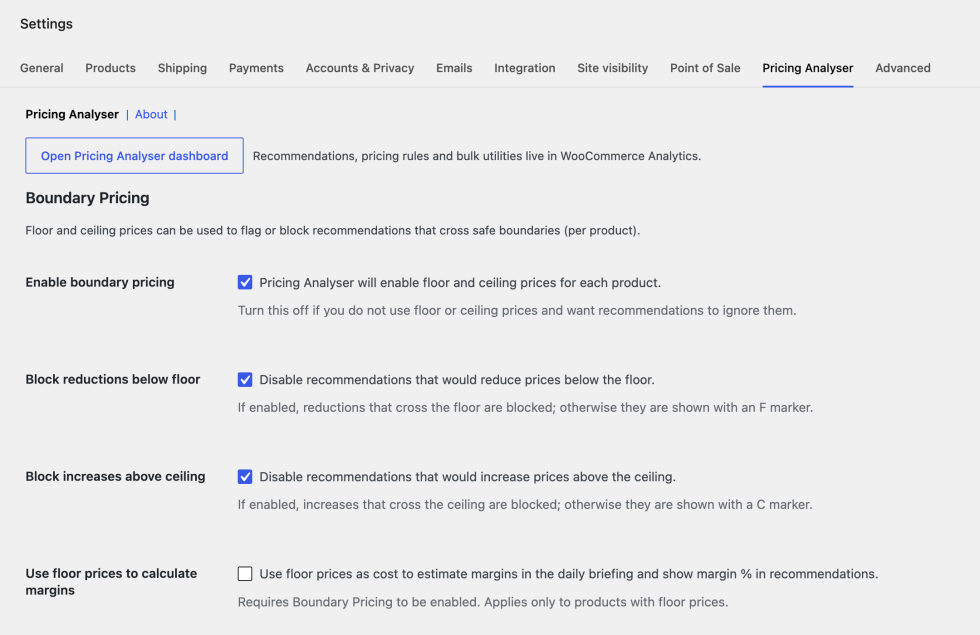
A floor price is the lowest price you consider acceptable for a product, and a ceiling price the highest. Together they define a safe pricing band. Set them per product on the product edit screen, or in bulk using Bulk Utilities.
- Enable boundary pricing – turns floor and ceiling handling on. Leave it off if you do not use boundaries.
- Block reductions below floor – a recommendation that would take a price below its floor is shown as inactive rather than applied.
- Block increases above ceiling – the same treatment for recommendations that would breach the ceiling.
- Use floor prices to calculate margins – treats the floor price as a proxy for cost, which enables margin percentages on the dashboard and profit figures in the daily briefing. It only affects products that have a floor price.
Boundary markers appear in the dashboard price column: an underlined F for a price at or below its floor, an overlined C for one at or above its ceiling.
Price rounding
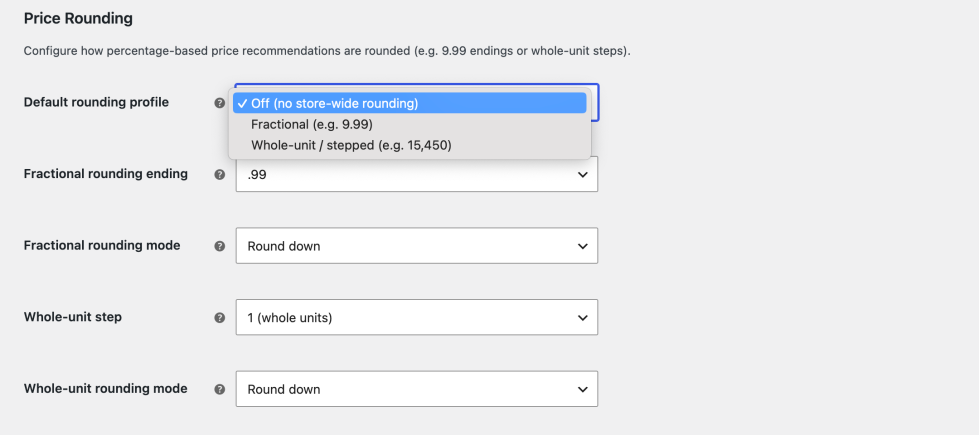
Rounding adjusts calculated prices so that recommendations end on commercially sensible figures rather than exact percentages.
- Default rounding profile – the store-wide behaviour, used unless an individual rule specifies its own.
- Fractional rounding – choose the preferred price ending, such as
.99or.95, and the rounding mode. - Whole-unit rounding – choose the step size and the rounding mode, for stores that prefer neat whole-number pricing.
Data and signals
- Sales and Interest history window – 30 or 60 days. This sets the period behind the Sales (30/60d) signal, Interest totals, the baseline available for trending, and the amount of history shown in charts. 30 days is more responsive; 60 gives a broader baseline.
- Respect sale prices – when enabled, products already on sale are left out of normal price-change recommendations, keeping promotional pricing separate from price optimisation.
- Interest filtering – excludes known bot traffic from interest data, so product views better reflect genuine attention.
- Bot user-agent fragments – the list used by that filter. The default list can be adjusted if your store has unusual traffic patterns.
Daily briefing email
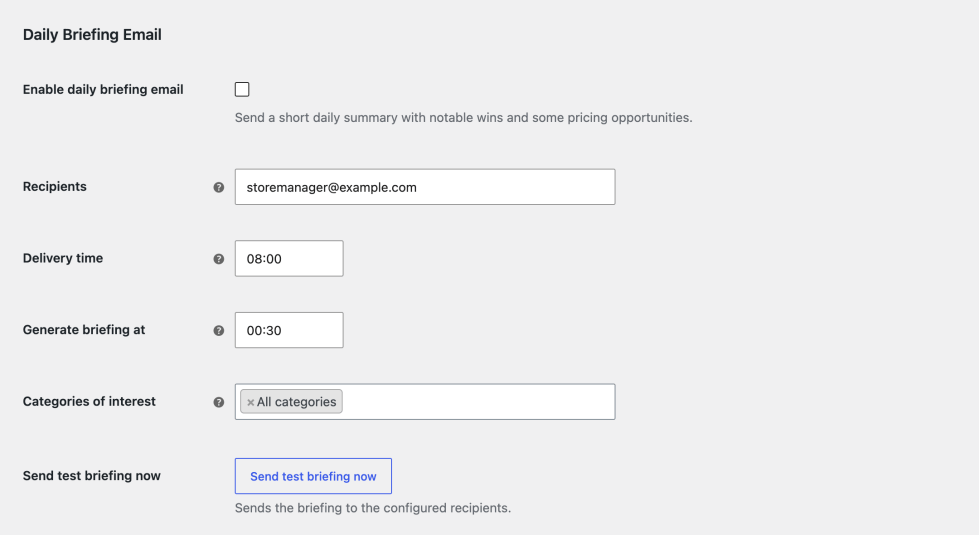
Controls the overnight summary email. What the briefing contains is covered under Daily briefing.
- Enable the briefing, and set the recipients – one or more addresses.
- Generation time and delivery time – the briefing is prepared first and sent later, so the data can be processed overnight and the finished email arrive at a useful hour. Pricing Analyser keeps the two times in a sensible order.
- Categories of interest – narrows the briefing to part of the catalogue.
- Send test briefing now – sends immediately to the configured recipients, for checking delivery, layout and addresses.
Tools
- Rules export and import – export your pricing rules as JSON and import them into another store, replacing or merging the existing set. Useful for backups and migrations.
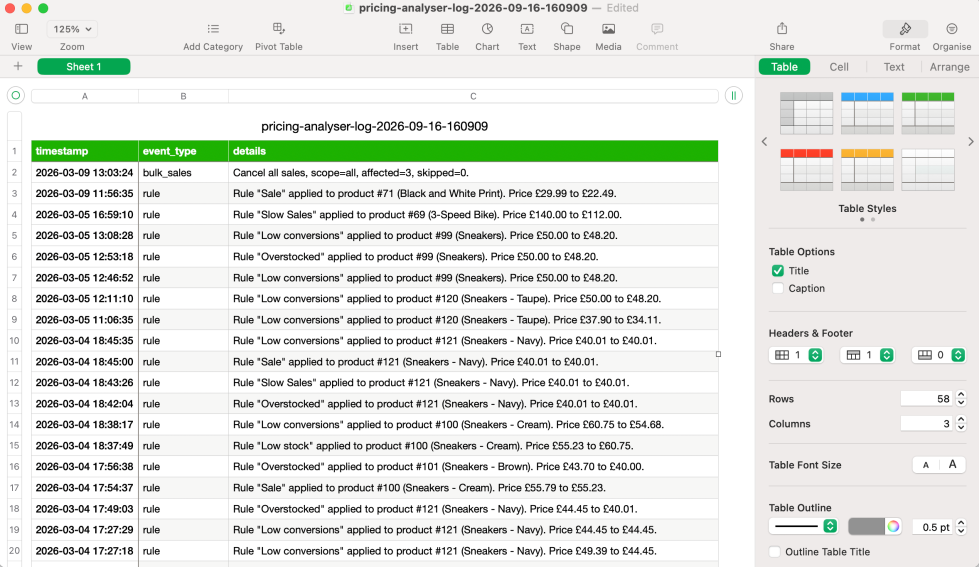
- Activity log – a record of rule-based and bulk actions, which can be exported as CSV or cleared.
- Remove data on uninstall – deletes Pricing Analyser data when the plugin is permanently removed. Deactivating the plugin does not remove data.
Known limitations
↑ Back to topPricing Analyser is designed to provide practical pricing guidance inside WooCommerce. These limits are part of the current scope of the plugin and are worth understanding when reviewing recommendations.
Variable products are evaluated at parent level
Sales, Interest and Conversion are primarily evaluated at product level rather than per variation, so a variation-level recommendation may be influenced by broader product-level performance rather than by that variation alone.
Interest is tracked at parent-product level. For many stores this still produces useful results, because customer interest usually begins at the product page rather than at a variation-specific URL, but it should not be read as variation-specific attention. Boundary pricing is likewise designed primarily around the main product workflow and may not offer the same variation-specific control in every case. Where this matters, review how the product is structured and how stock and pricing are being managed.
Price history is limited and summarised
Price history stores a fixed number of changes rather than acting as an unlimited archive. This keeps the feature lightweight, but very old price movements may no longer be shown once newer changes have replaced them.
For products with many variations, the inline sparkline is a summary view and may not show every variation line at once. The larger modal chart provides more detail.
The dashboard and briefing are selective
When more than one rule matches a product, the dashboard highlights the strongest current recommendation. Other matched rules can still be reviewed, but the dashboard prioritises the most significant action rather than showing every matched rule with equal prominence.
The Daily Briefing is a summary rather than a complete dump of dashboard data, and may not include every recommendation or notable product on every run.
Today’s chart data is partial
Charts and sparklines can include today’s sales and interest, but today is still an incomplete day. The final point or bar should be read as partial-day activity rather than a complete daily total.
Signals are operational indicators, not precise analytics
Signals such as Trending, Interest and Conversion are designed as useful operational indicators rather than perfect analytical measures. Pricing Analyser does not attempt to model every nuance of merchandising, attribution or customer behaviour.
Bot filtering improves the quality of Interest data, but no filtering approach can remove all non-human traffic or guarantee that every recorded product view represents genuine purchase intent.
Some product types are excluded
Pricing Analyser is designed primarily for simple and variable products. Grouped and external products are intentionally excluded from the main recommendation workflow, where pricing recommendations would not make practical sense.
Scheduled features depend on WordPress cron
Features such as the Daily Briefing depend on WordPress cron unless the store is configured to use a real server-side cron job. On low-traffic or test sites, scheduled tasks may not run exactly on time if WordPress cron is not triggered regularly.
Recommendations support judgement rather than replace it
Pricing Analyser provides guidance based on store data and merchant-defined rules, but it cannot know every commercial factor affecting a product. Supplier changes, seasonality, branding considerations and strategic promotions may all justify decisions that differ from the recommendation.
Troubleshooting
↑ Back to topIf Pricing Analyser is not behaving as expected, the following checks resolve most issues.
Start with the basics
↑ Back to top- Make sure WordPress, WooCommerce and Pricing Analyser are all up to date.
- Check WooCommerce → Status for anything flagged in the system status report.
- Clear any caching or optimisation plugin caches before retesting.
Rule out a plugin or theme conflict
↑ Back to topMost unexpected behaviour in WordPress comes from a conflict with another plugin or the active theme. Where possible, test on a staging site rather than a live store.
- Temporarily deactivate other plugins, leaving WooCommerce and Pricing Analyser active, and check whether the problem persists.
- Switch to a default theme such as Storefront to rule out theme-specific issues.
- Reactivate plugins one at a time, retesting after each, to identify the source.
No recommendations are appearing
↑ Back to top- Check that your rules are enabled, and that their scope includes the products you expect.
- Most signals need several days of data before they can trigger – up to 60 days for the longer windows – so a new installation will show few recommendations at first.
- Check whether a cooldown is suppressing a repeat recommendation.
- Confirm the product type is supported. Grouped and external products are excluded from the recommendation workflow.
- If boundary pricing is enabled, check that a floor or ceiling is not blocking the change.
The daily briefing is not arriving
↑ Back to top- Use Send test briefing now in the settings to check delivery independently of the schedule.
- Check the recipient addresses, and look in spam or junk folders.
- Scheduled sending depends on WordPress cron. On low-traffic sites, consider configuring a real server-side cron job so scheduled tasks run reliably.
Glossary
↑ Back to topThis glossary explains the main terms used throughout Pricing Analyser.
- Boundary Pricing – The use of floor and ceiling prices to define an acceptable pricing range for a product.
- Ceiling Price – The highest price considered acceptable for a product. Pricing Analyser can use this when assessing whether a recommended price change would move too high.
- Cooldown – A period during which a rule that has already triggered for a product is prevented from recommending another change for that same product.
- Dashboard – The main Pricing Analyser screen where products, signals, charts and recommendations are reviewed.
- Daily Briefing – The summary email generated by Pricing Analyser to highlight recent store activity and notable pricing opportunities.
- Floor Price – The lowest price considered acceptable for a product. It can be used to protect margin and, where enabled, to estimate product margins.
- Ignore – An option on the dashboard that allows a product to be excluded from immediate pricing action in the current review workflow.
- Interest – A measure of product view activity. Interest is used as an indication of customer attention rather than confirmed demand.
- Margin – The difference between selling price and floor price, expressed as a percentage when margin calculation is enabled and a floor price is available.
- Price History – A record of how a product’s price has changed over time.
- Recommendation – A suggested pricing action generated when a product matches one of the merchant’s pricing rules.
- Recommendation Chip – The visual label shown on the dashboard that displays the matched rule and suggested price movement for a product.
- Rounding – The process of adjusting calculated prices so that suggested prices use cleaner or more commercially appropriate endings, such as .99 or whole-unit steps.
- Rule – A pricing condition defined by the merchant. A rule checks one signal against a threshold and recommends a pricing action when the condition is met.
- Scope – The set of products a rule or bulk action applies to, such as all products, selected categories or selected products.
- Signal – A measurable product-performance value used by Pricing Analyser when evaluating rules.
- Suggested New Price – The calculated price proposed by Pricing Analyser when a rule matches.
- Variation – A specific version of a variable product, such as a particular size or colour.

