Role Based Analytics for WooCommerce introduces a dedicated User Roles report page inside WooCommerce Analytics. Perfect for stores that manage customers with built-in or custom WordPress user roles, it lets you filter, compare, and visualize sales report by User Roles. With performance cards, time and User Role comparison charts, and CSV exports, you’ll gain clear insights into purchasing behavior, sales trends, and opportunities for targeted marketing.
Installation
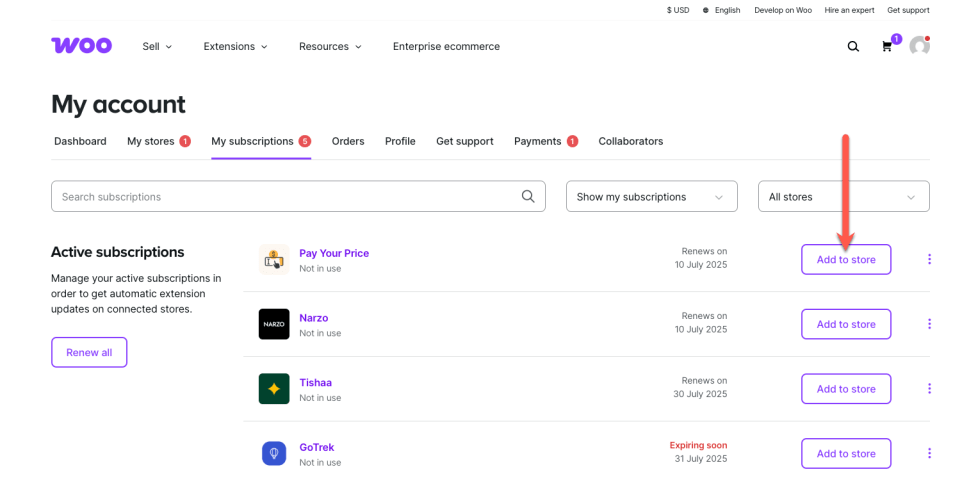
↑ Back to topTo start using a product from WooCommerce.com, you can use the “Add to store” functionality on the order confirmation page or the My subscriptions section in your account.
- Navigate to My subscriptions.
- Find the Add to store button next to the product you’re planning to install.
- Follow the instructions on the screen, and the product will be automatically added to your store.
Alternative options and more information at:
Managing WooCommerce.com subscriptions.
✅ Requirements:
WordPress: Version 6.2+
WooCommerce: Version 7.1+
PHP: Version 8.1+ recommended
Important Note on Role Based Analytics for WooCommerce :
This plugin adds a User Role filter to WooCommerce Analytics. To use it effectively, make sure you’re already grouping your customer using WordPress user roles—either through custom code or a user role management plugin.
Compatibility
↑ Back to top- High-Performance Order Storage (HPOS):
Role Based Analytics for WooCommerce is fully compatible with WooCommerce’s High-Performance Order Storage (HPOS) for faster and more reliable reporting. - User Role Extensions:
The plugin works with any plugin that extends or customizes WordPress user roles. It can run stand-alone or alongside any tool that adds or modifies user roles for customer segmentation.
Setup and Configuration
↑ Back to topSettings
↑ Back to topOnce you install and activate Role Based Analytics for WooCommerce, it starts working right away.
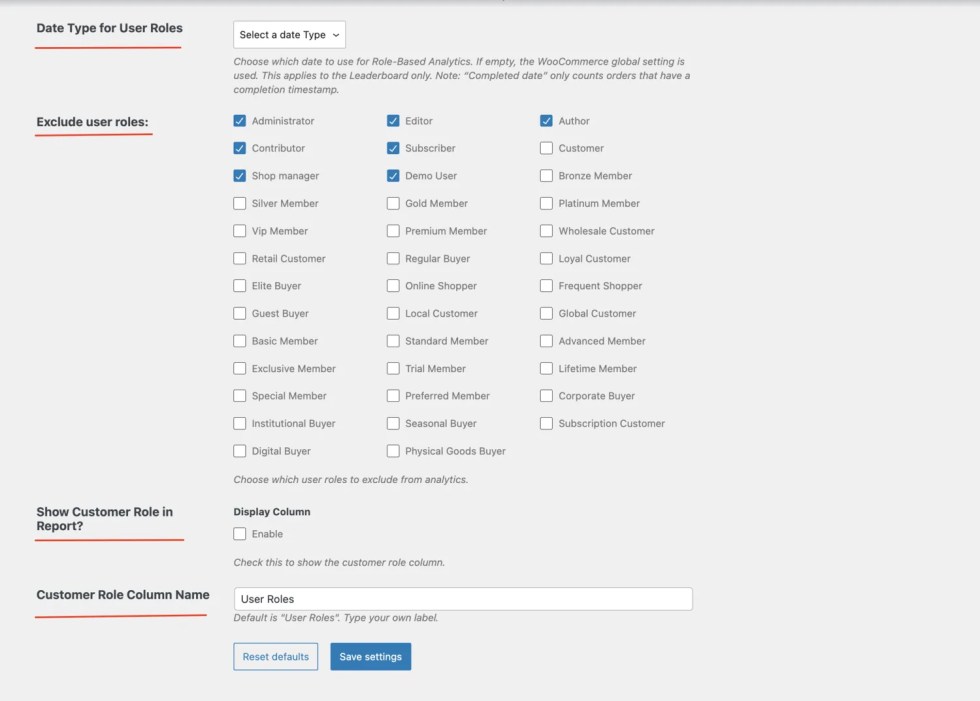
If you want to adjust how user roles are shown or excluded in analytics reports, you can configure the plugin settings by going to: Dashboard → Analytics → Settings
1. Date Type for User Roles
By default, Role Based Analytics for WooCommerce follows the WooCommerce Analytics Date Type setting. This means your User Roles Report page and User Role Leaderboard will use the same date type (e.g., Created, Paid, Completed) that WooCommerce is configured to report on.
If you’d like to use a different date type specifically for User Roles reporting, you can change it directly in the plugin’s settings. Once updated, both the User Roles Report page and Leaderboard will reflect data based on your selected date type.
2. Exclude User Roles
Select any user roles that should be excluded from the analytics data. This is useful for roles like Administrator, Editor, or Shop Manager, who may occasionally place test orders or internal purchases. These roles are excluded by default but can be adjusted to fit your store’s needs.
3. Show Customer Role in Report?
Enable this setting if you want the Customer role name to appear in the analytics reports.
By default, WooCommerce automatically assigns the Customer role to every user who makes a purchase. If you’re using custom roles like Wholesale Buyer or Silver Member, users will still have the Customer role unless you’ve changed that behavior manually.
This option lets you control whether the Customer role name should be displayed in the report data.
- If enabled: The Customer role will be included in the role column.
- If disabled: The Customer role will be hidden—unless it’s the only role assigned to that user. In that case, the Customer role will still appear in the report, because there’s no other role to show.
4. Change column name ?
Customize the label for the User Role column shown in analytics reports and CSV exports.
By default, the column is labeled “User Roles”, but you can change it to match your store’s terminology.
Example: You might prefer to name it “Customer Group” if that’s how you segment your users internally.
User Roles Report Page
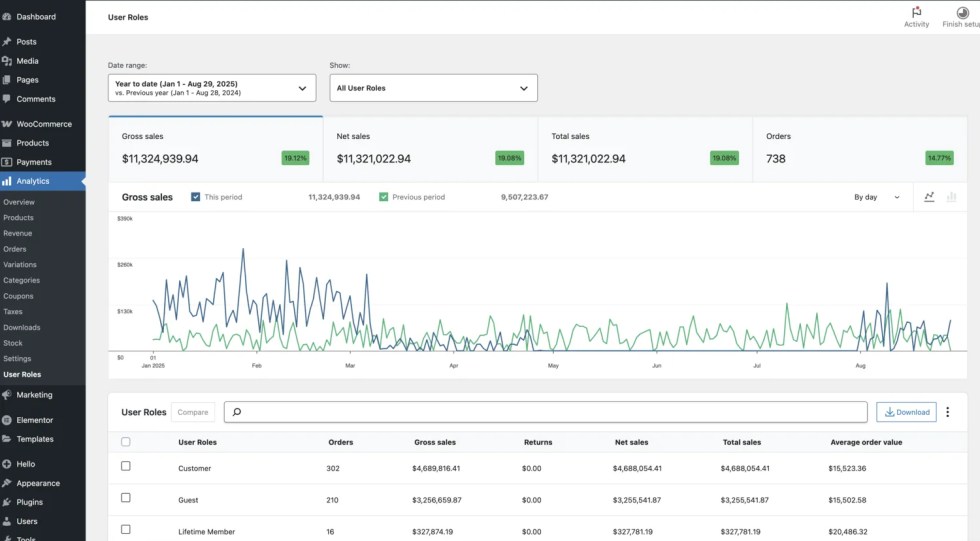
↑ Back to topThe User Roles Report Page in Role Based Analytics for WooCommerce lets you analyze sales performance by any WordPress user role. It provides dedicated insights into orders, sales, and trends grouped by user roles you assign in your store.
Features of the User Roles Report Page
↑ Back to top
- Performance Cards – Instantly see totals for orders, customer count, gross sales, returns, net sales, total sales, and average order value.
- Role Comparisons – Compare multiple user roles side by side with interactive charts.
- Time vs. Role Charts – Switch between Time Comparison (this period vs. previous) and Role Comparison charts to visualize trends.
- Single & Multi-Role Filtering – Focus on a specific role or select multiple roles for broader insights.
- Actionable Insights – Identify role-based sales patterns and use the data to refine pricing, promotions, or loyalty programs.
- CSV Export – Download role-based data for further analysis outside WooCommerce.
How to Access the User Roles Report Page
↑ Back to top- In your WordPress dashboard, go to Analytics → User Roles.
- Apply filters for the date range and the user roles you want to analyze.
- Use the tabs and charts to explore performance by time or by role.
- Export results if you need a CSV file for external reporting.
Filtering User Role Analytics by Date
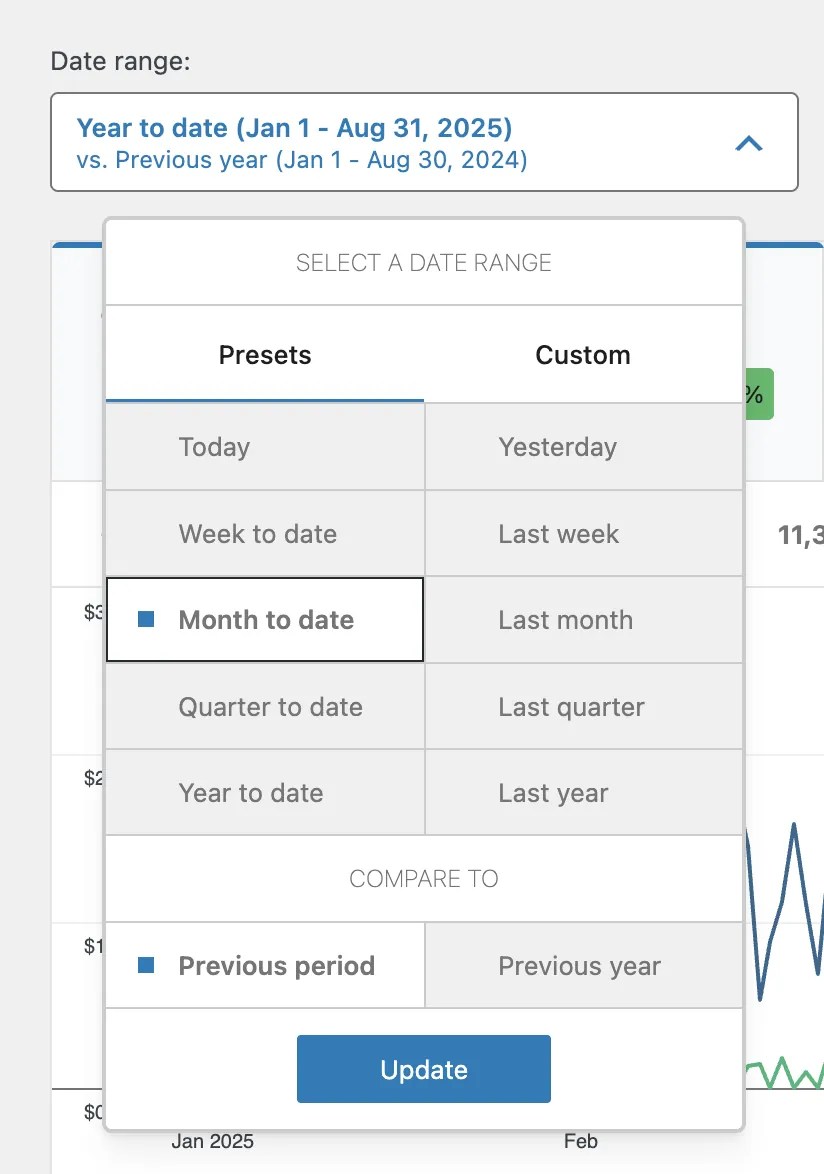
↑ Back to topThe User Roles Report page in Role Based Analytics for WooCommerce supports the same powerful date filtering options as WooCommerce Analytics. This allows you to analyze role-based sales data over any time range with just a few clicks.
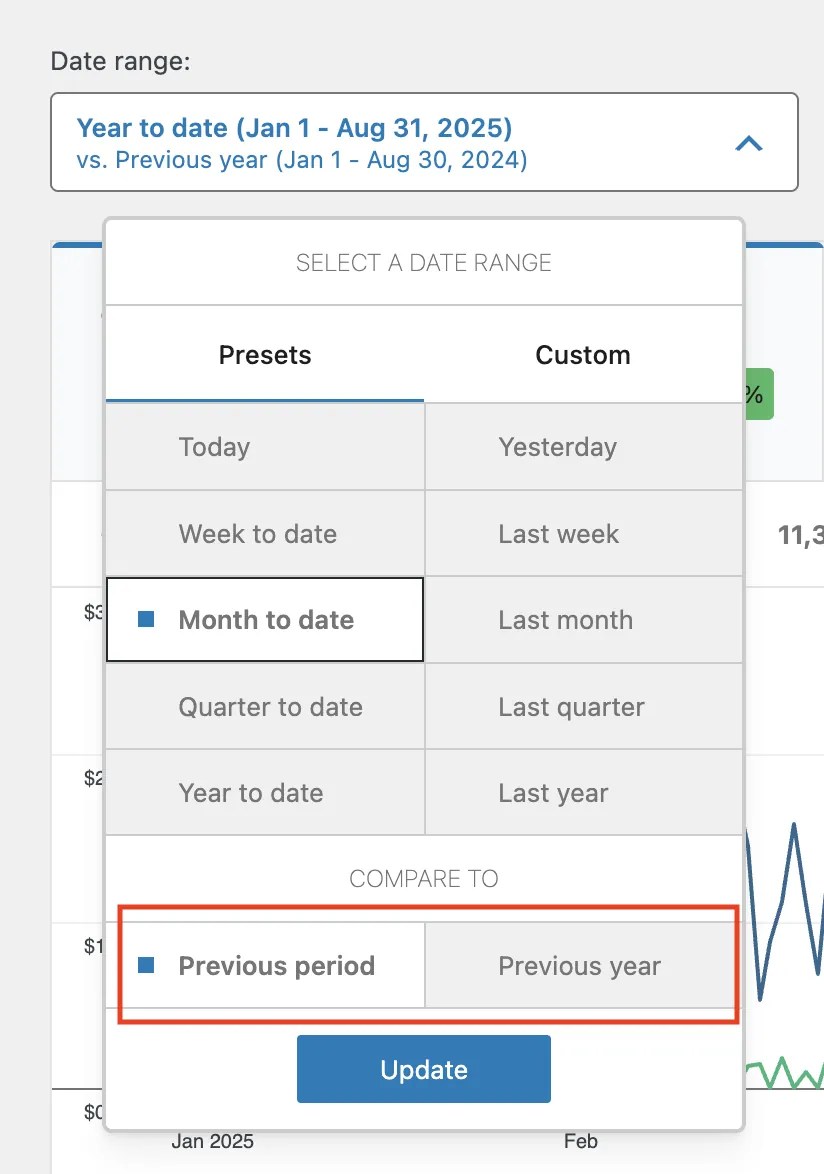
Presets Time
Quickly select from common time ranges such as: Today, Yesterday, Week to date, Last week, Month to date, Last month, Quarter to date, Last quarter, Year to date, and Last year.
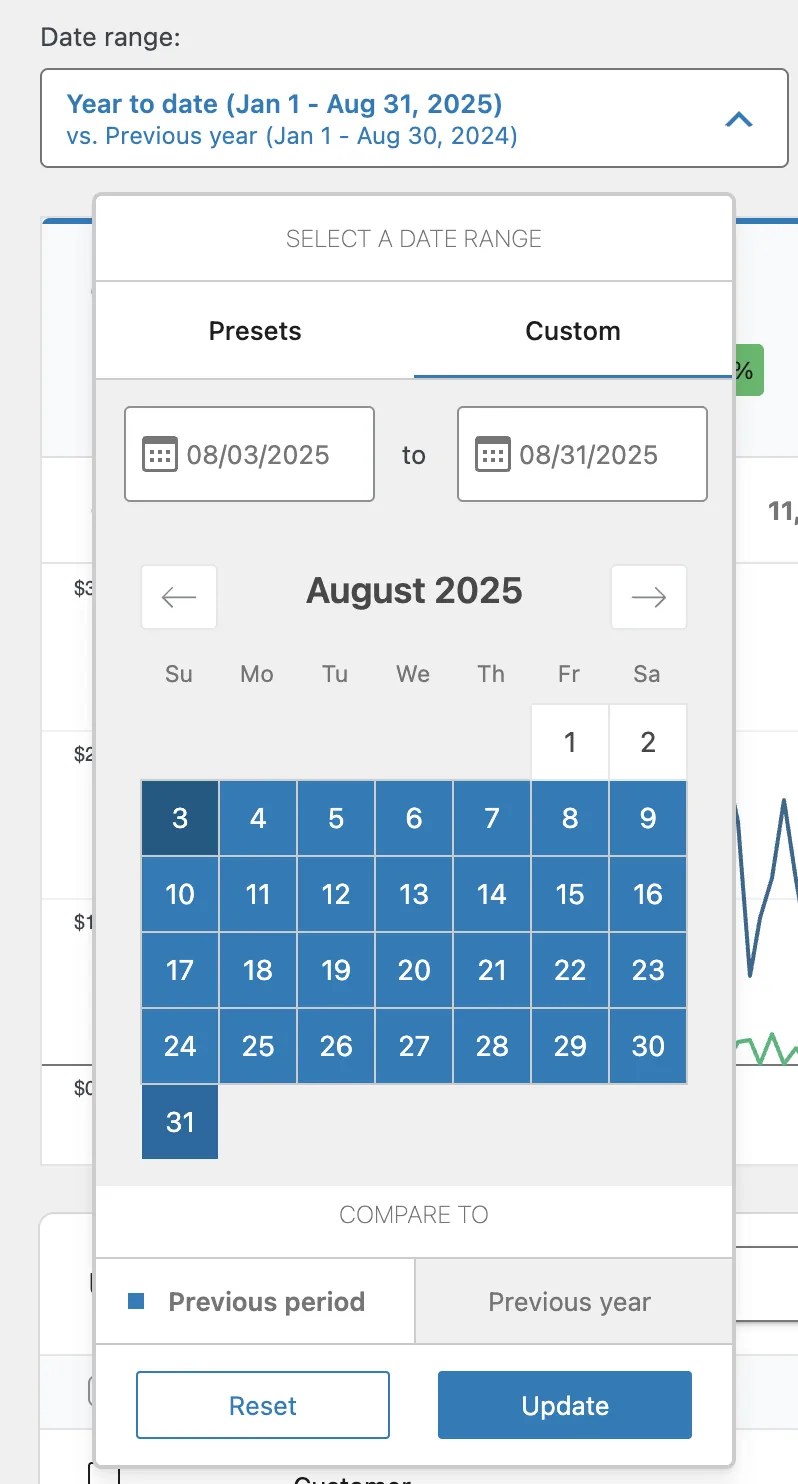
Custom Date Range
If the presets don’t fit your needs, you can choose a custom start and end date. This is useful for analyzing promotions, seasonal campaigns, or specific reporting periods.
Compare Options
Along with the selected period, you can compare results against:
- Previous year (e.g., compare this year-to-date with the same period last year)
- Previous period (e.g., compare this month with the last month)
Filter WooCommerce Analytics by a Single User Role
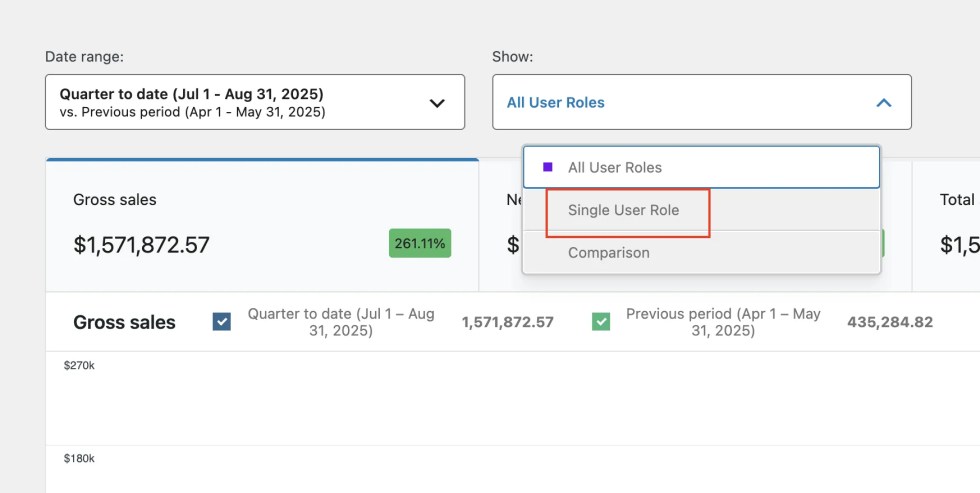
↑ Back to topWhen you need to analyze just one user role in detail, the Single User Role Filter gives you a clear, role-focused view of your store’s performance:
Navigate to the filter
From the User Roles Report page, click the All User Roles dropdown and select a single role. This could be a default WooCommerce role (like Customer or Subscriber) or a custom role you’ve created (such as Wholesale or VIP).
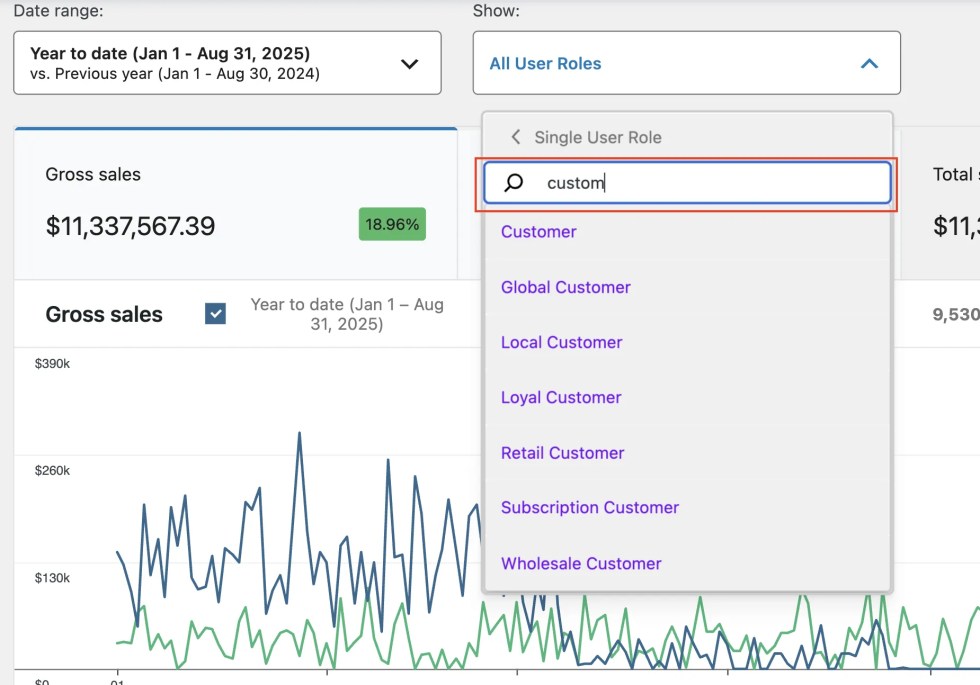
Search and select the role
Start typing the role name (e.g., Customer, Wholesaler, or Subscriber) in the search field. Select the desired role from the list.
View role-specific results
Once selected, the report automatically refreshes to display Performance Cards, comparison options, trend charts, and the data table filtered to that single role. You’ll see exactly how this role contributes to orders, sales, returns, and average order value.
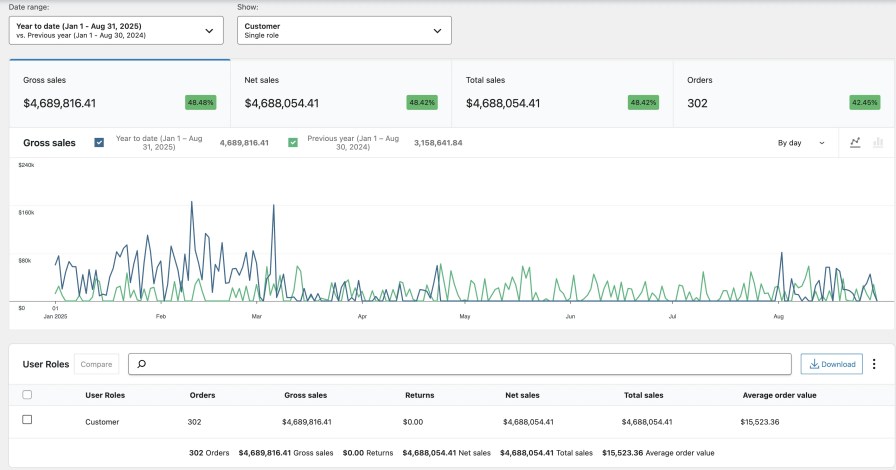
Compare Multiple User Roles in WooCommerce Analytics
↑ Back to topThe Comparison User Roles feature lets you analyze multiple roles side by side within the User Roles Report. Instead of focusing on a single role, you can select two or more user roles (e.g., Customer, Wholesaler, Subscriber, VIP) and instantly compare their performance metrics.
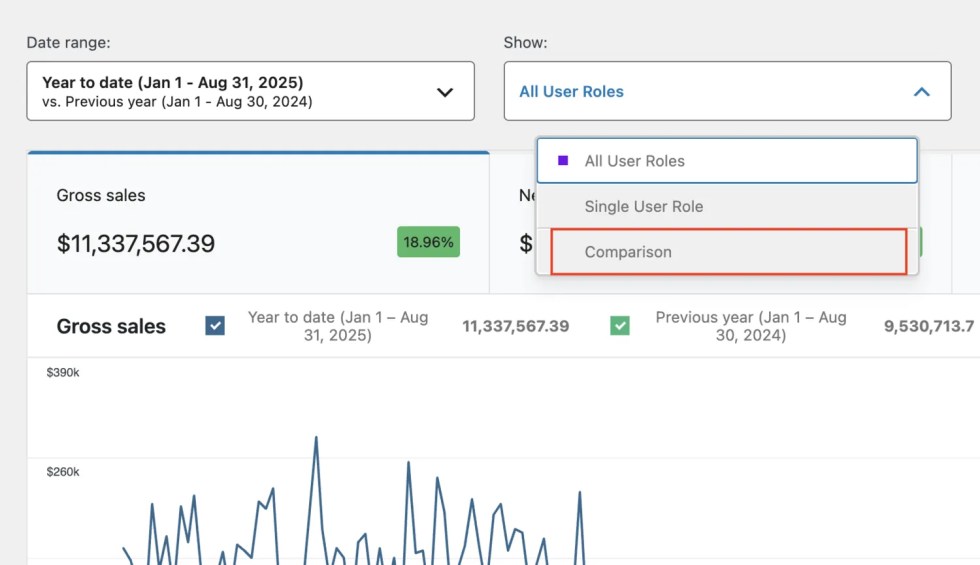
Navigate to Comparison Mode
From the Show dropdown in the User Roles report, select Comparison. This unlocks the role comparison interface.
Search and Select Roles
Use the search bar to quickly find and add two or more user roles you want to compare. You can add multiple roles at once.

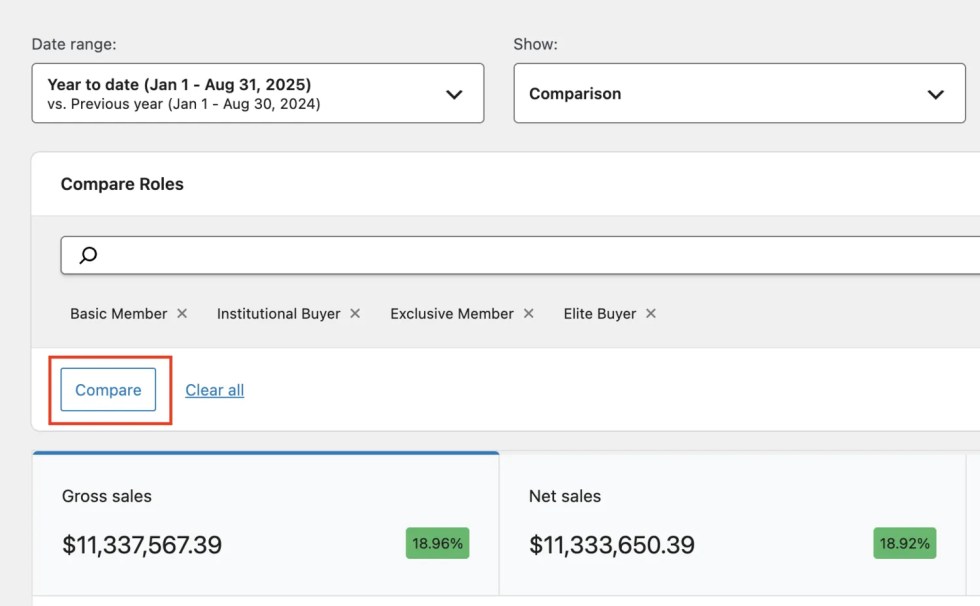
Apply and Compare
After selecting your roles, click Compare. The report updates to show side-by-side performance metrics.
View Detailed Multiple User Roles Comparison results
When comparing roles, the dashboard shows:
- Export Option – Download the comparison data as a CSV for further analysis.
- Performance cards – Key metrics like Gross Sales, Net Sales, Total Sales, and Orders, with percentage changes.
- Charts – Role-based sales trends, color-coded for each role, so you can easily spot differences over time. You can check and unchecked from the chart to see instant comparison between user roles.
- Data Table – A detailed breakdown of orders, customer count, gross sales, returns, and AOV per role, with totals across all compared roles.
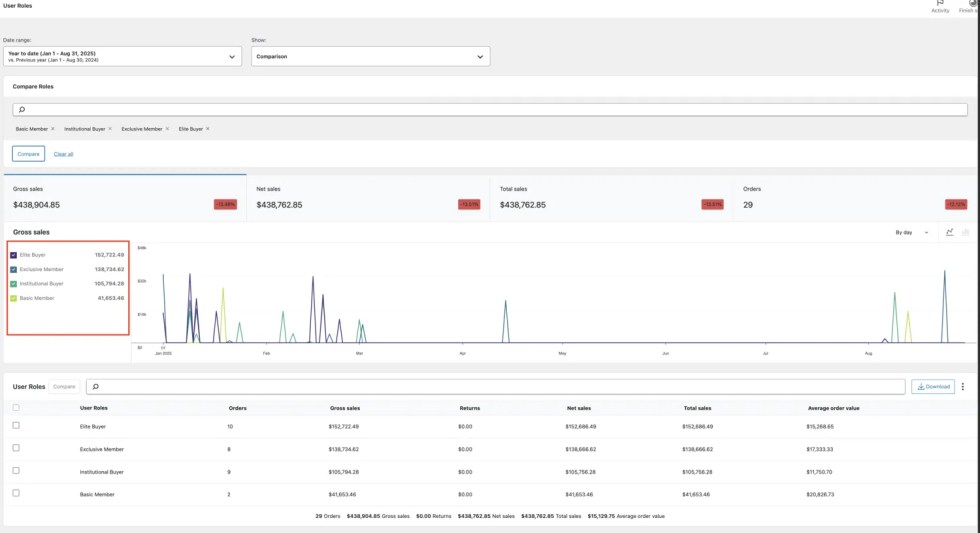
Compare User Roles Directly from the Report Table
↑ Back to topIn addition to using the “Comparison” mode dropdown, you can also compare user roles directly from the User Roles Report table. This makes it easy to analyze multiple roles without leaving the table view.
Here’s how it works:
Navigate to the User Roles Report Table Scroll down to the User Roles table in your report. Each row shows performance data (Orders, Gross Sales, Returns, Net Sales, Total Sales, and Average Order Value) for a specific role.
Select Roles for Comparison Check the boxes next to the roles you want to compare (e.g., Guest, Online Shopper, Gold Member, Silver Member). Once selected, click the Compare button at the top of the table.
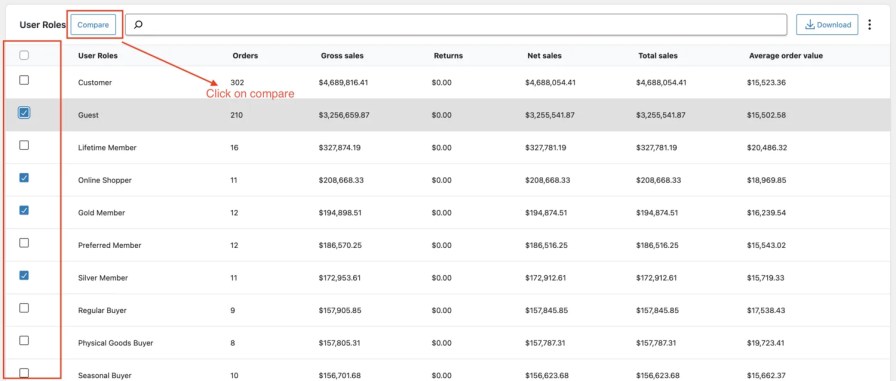
View Comparison Results The report instantly updates to show:
- Performance Cards: Summary KPIs for selected roles: Orders, Gross Sales, Net Sales, and Total Sales.
- Comparison Chart: Visualize sales trends across multiple roles.
- Detailed Table: Side-by-side breakdown of metrics, including totals and averages.
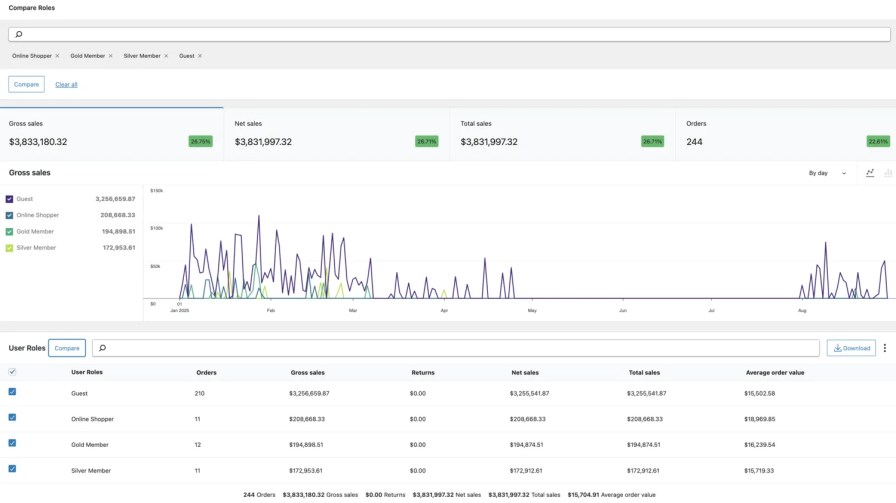
Analyzing Multiple User Roles in WooCommerce Analytics
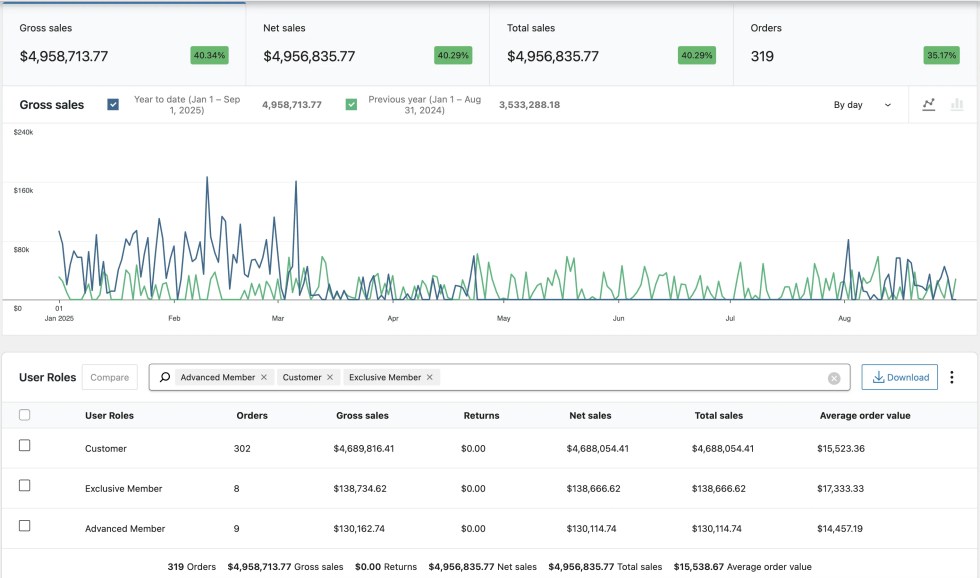
↑ Back to topWith the multiple user role filter, you can view analytics across several roles in one report. Instead of being limited to a single role, you can include multiple roles (e.g., Customer, Exclusive Member, Advanced Member) and analyze their combined performance.
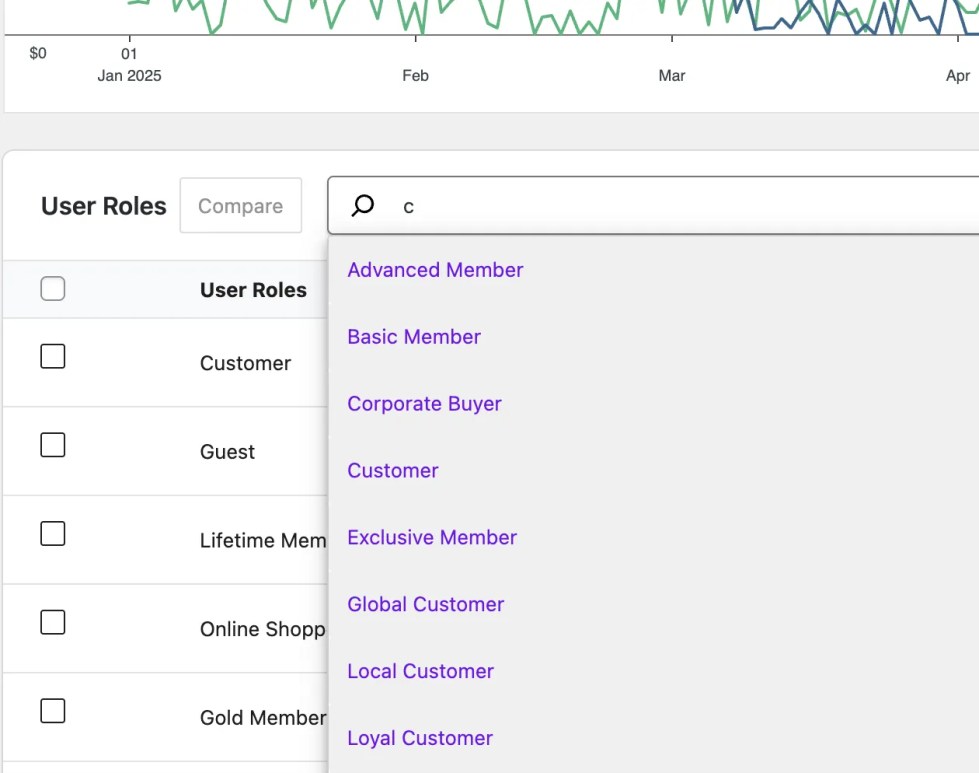
Search and Select Roles
Use the role search bar to quickly find and add multiple roles. (check the screenshot)
View Combined Results – The analytics dashboard updates instantly to show:
- Performance Cards – Gross Sales, Net Sales, Total Sales, and Orders aggregated for the selected roles.
- Charts – Visualize overall sales and trends for the chosen roles combined.
- Data Table – A breakdown of how each included role contributes individually, alongside totals and averages. (check the screenshot)
Performance Cards in User Role Reports
↑ Back to topPerformance Cards provide a quick overview of your key store metrics, tailored to the selected user roles and date range. These cards appear at the top of the report and update instantly whenever you adjust filters.

1. Metrics Available
- Gross Sales – Total sales before refunds/returns.
- Net Sales – Sales after refunds/returns are deducted.
- Total Sales – Adjusted sales totals (same as net sales in most stores).
- Orders – Total number of based on user role filet orders.
2. Dynamic Interaction

- You can click on any Performance Card to focus on that metric.
- When selected, the chart below automatically updates to show trends for that metric (e.g., switching from Gross Sales to Orders will update the graph and comparison data to reflect orders instead of sales).
- This helps you analyze performance from different perspectives without leaving the report.
3. Time Comparison
- Metrics are always tied to your chosen date range.
- If comparison is enabled, you’ll see:
- This period – e.g., Quarter to date (Jul 1 – Sep 1, 2025).
- Comparison period – e.g., Previous period (Apr 1 – Jun 1, 2025) or Previous year (Jul 1 – Sep 1, 2024).
- Percentage change is calculated automatically (green = growth, red = decline).
Example from screenshots:
- Gross Sales (Jul 1 – Sep 1, 2025) → $685,358.63
- Previous period (Apr 1 – Jun 1, 2025) → $223,211.82
- Result → +207.04% growth.
4. Role-Specific Insights
- All Roles → Shows overall totals across all customers.
- Single User Role → Focuses on one role (e.g., Wholesaler, Subscriber, VIP).
- Multiple User Roles → Combines performance of selected roles.
Charts in User Roles Analytics
↑ Back to topPerformance Cards provide a quick overview of your key store metrics, tailored to the selected user roles and date range. These cards appear at the top of the report and update instantly whenever you adjust filters.
Common Chart Styles
The common chart is fully interactive and works together with the performance cards:
Dynamic updates: Selecting a performance card (Gross Sales, Net Sales, Total Sales, or Orders) instantly updates the chart to reflect that metric.
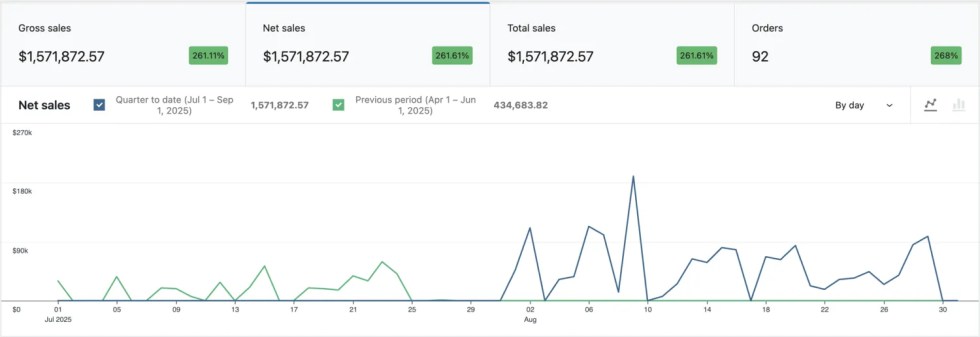
Time segmentation: Adjust the data view by Day, Week, Month, or Quarter to better match your reporting needs.

Chart style toggle: Switch between Line Chart (for trend visualization) and Bar Chart (for easy value comparison).

This flexibility makes it easy to analyze short-term spikes, monthly patterns, or quarterly growth across user roles.
Time Comparison Chart
The Time Comparison Chart allows you to compare sales across two different periods.
For example:
- Quarter to Date (Jul 1 – Sep 1, 2025) vs Previous Period (Apr 1 – Jun 1, 2025).
Both periods are displayed side by side in different colors, so you can instantly see growth, decline, or consistency. Hovering over points shows exact values for each period, making comparisons precise and easy.

User Roles Comparison Chart
The User Roles Comparison Chart lets you analyze multiple roles in the same time-frame.
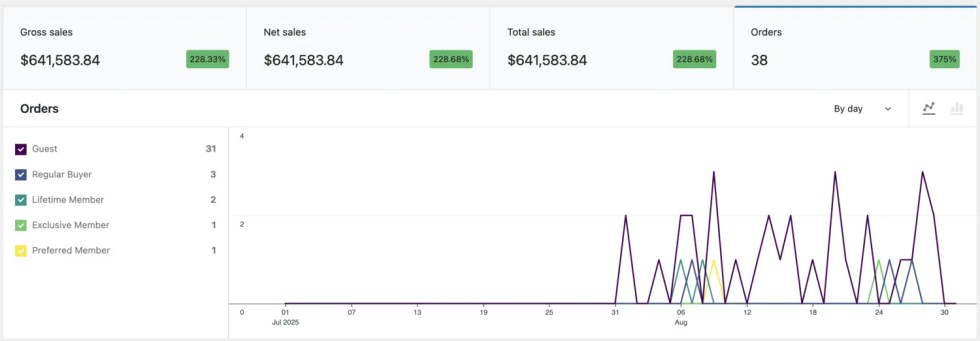
- Each role is color-coded for clarity.
- Compare contributions of roles like Customer, Guest, Exclusive Member, or Advanced Member at a glance.
- Charts update dynamically with performance cards, so you can see Gross Sales, Net Sales, Orders, or Total Sales per role.
This is especially useful for identifying high-value roles or spotting under-performing groups.
WooCommerce user roles Analytics Table
↑ Back to topThe User Roles Data Table provides a detailed breakdown of performance metrics for each role. It is fully interactive and designed to give you flexibility in analyzing and exporting your data.

Key Features:
- Checkbox Comparison – Select one or more user roles using the check boxes in the first column. After selecting, click Compare to generate a comparison chart and performance cards for those roles.
- Search and Filter – Use the search bar above the table to quickly locate specific roles (e.g., Guest, Member, Subscriber). Multiple roles can be selected at once for side-by-side analysis.
- Performance Metrics – Each row displays key metrics by role:
- Orders
- Gross Sales
- Returns
- Net Sales
- Total Sales
- Average Order Value (AOV)
- Summary Totals – At the bottom, a summary row aggregates totals across all roles, giving you an overall snapshot of store performance.
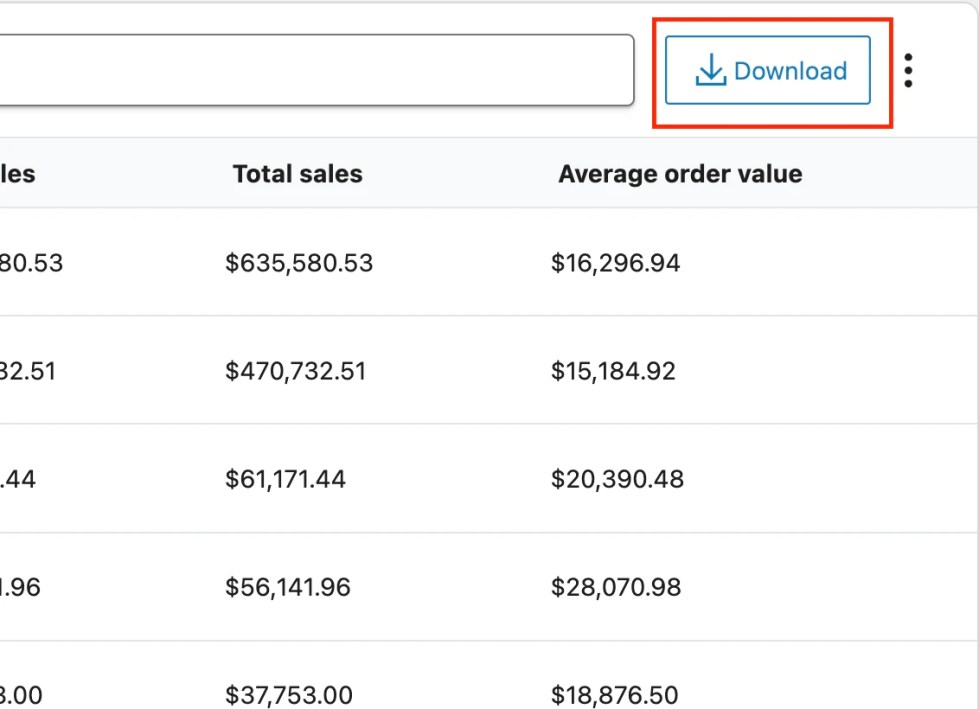
- Download Data – Export the table data to CSV by clicking the Download button in the top-right corner. This makes it easy to use your role-based analytics in spreadsheets or external reports.
- Show / Hide Columns – Use the three-dot menu (top-right) to customize your view by showing or hiding table columns.
This flexible table makes it easy to drill down into user roles, compare groups, and export data for deeper analysis.
Export WooCommerce User Roles Analytics Data
↑ Back to topThe User Roles Data Table provides a detailed breakdown of performance metrics for each role. It is fully interactive and designed to give you flexibility in analyzing and exporting your data.
Navigation
From the User Roles report table, click the Download button (top-right corner above the table). This will generate a CSV file containing all selected user role metrics.
CSV File Example
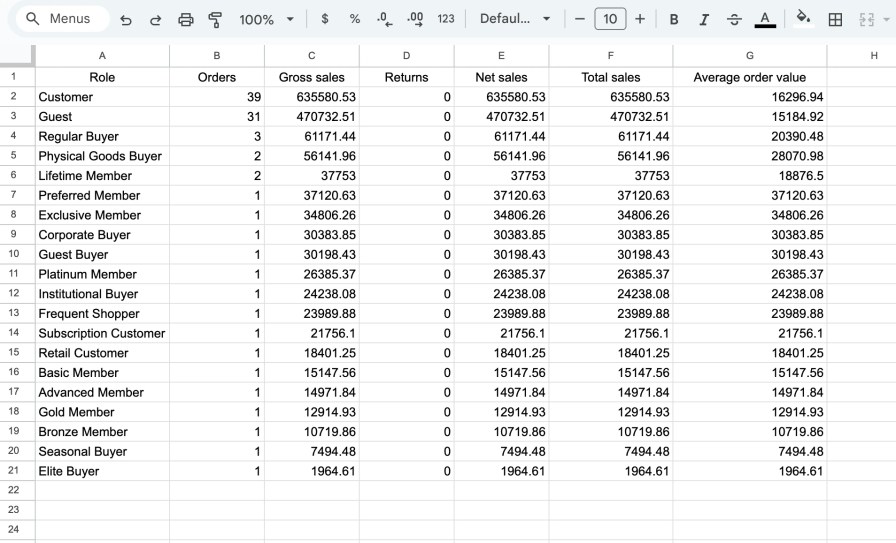
The exported CSV file provides a complete breakdown of WooCommerce sales performance data, including user roles, orders, gross sales, net sales, total sales, returns, and average order value (AOV). This export makes it easy to analyze user role reports outside WooCommerce, as the file can be opened in Google Sheets, Excel, or any spreadsheet software. By exporting WooCommerce analytics, store owners gain flexibility to filter, compare, and share data for deeper insights into role-based sales trends.
User Roles Leaderboard
↑ Back to topCharts provide a powerful way to visualize sales and order data by user roles. They adapt automatically to your filter, time, and performance card selections, making it easier to identify patterns, trends, and role-specific contributions.
Features of the User Roles Leaderboard
↑ Back to top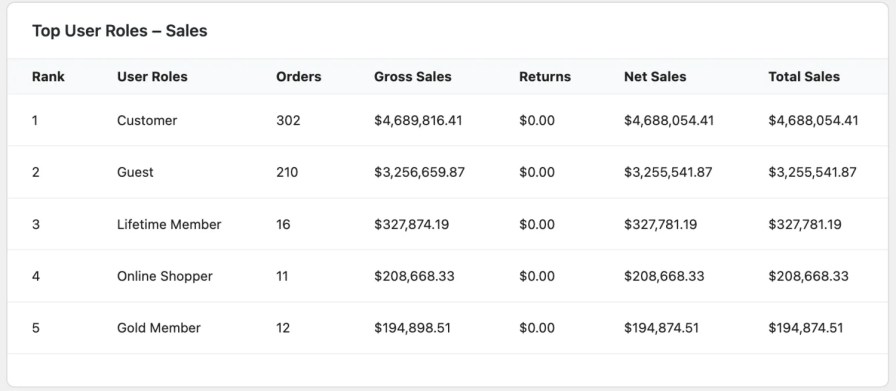
- Rankings – Instantly rank user roles by orders, gross sales, returns, net sales, and total sales.
- Quick Insights – Compare customer groups at a glance to identify your most valuable segments.
- Trend Awareness – Spot which roles are growing or declining in performance.
- Actionable Data – Use leaderboard results to adjust marketing, pricing, or loyalty programs.
How to Show the User Roles Leaderboard
↑ Back to top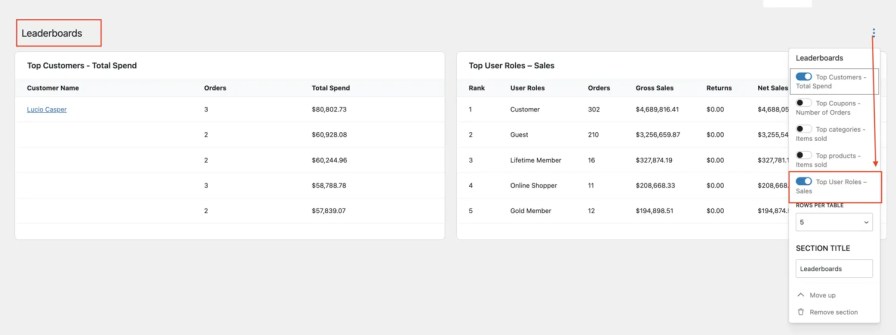
- In your WordPress dashboard, go to Analytics → Overview → Leaderboard.
- Click the three dots menu in the top right corner of the Leaderboard section.
- From the list of available leaderboards, enable “User Roles.”
- The User Roles Leaderboard will now display alongside your other WooCommerce leaderboards.
User Roles Analytics and Sales Report Calculations
↑ Back to topThe User Roles Analytics Report provides accurate performance insights for each user role by applying standard WooCommerce sales calculations. These calculations ensure that store owners can easily understand revenue, refunds, and order performance across different customer groups. Metrics such as Gross Sales, Net Sales, Total Sales, Orders, Returns, and Average Order Value (AOV) are tailored to reflect sales activity segmented by user roles. This allows you to quickly identify how each role contributes to overall store performance and make informed business decisions.
| Term | Description |
|---|---|
| Gross Sales | Total value of products sold (product price × quantity). Excludes refunds, coupons, taxes, and shipping. |
| Net Sales | Gross Sales minus Returns and Coupons. This represents the actual revenue retained after discounts and refunds. |
| Total Sales | Gross Sales adjusted for Returns and Coupons. May also include taxes and shipping if applicable. |
| Orders | The total number of orders placed in the selected date range for the given user role(s). |
| Returns | The total value of refunded sales attributed to the user role(s). |
| Average Order Value (AOV) | Net Sales divided by the number of Orders — indicates the average spend per order. |
Existing Report Page
↑ Back to top1. Go to Analytics → Products (or Orders, Categories, Coupons, Downloads).
2. At the top of the report, you’ll see a new User Role dropdown filter.
3. Select a specific role (e.g., Wholesaler, Silver Member any User Roles that you created and excluded by) to view sales data only for that user Role.
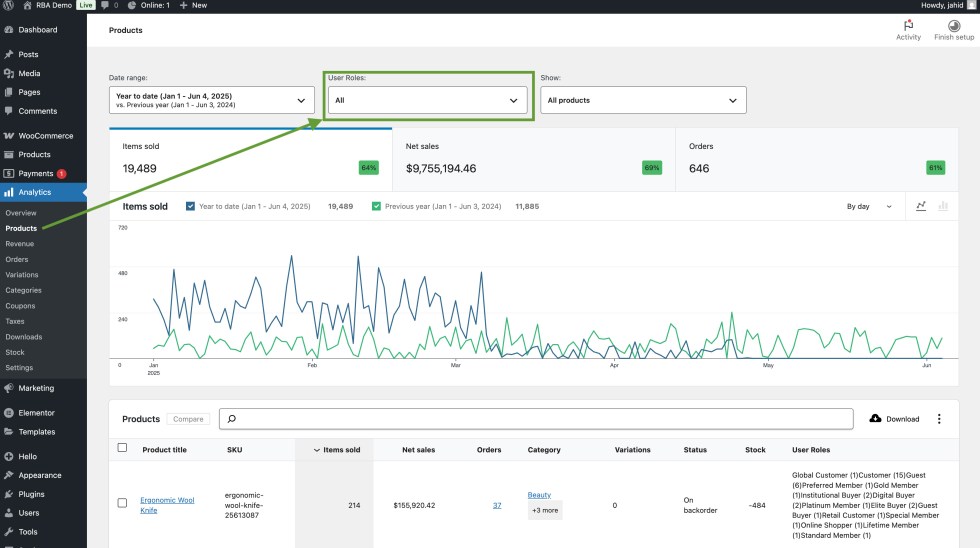
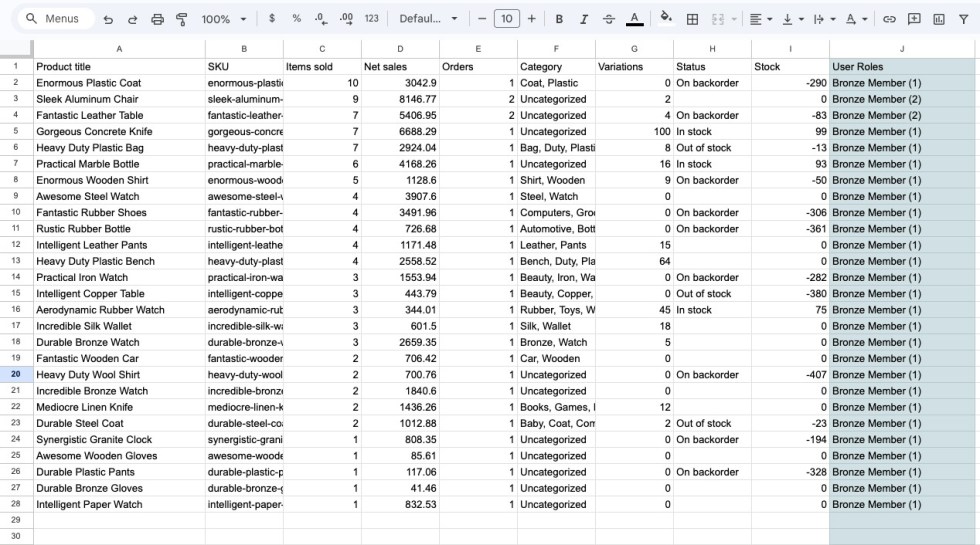
4. In the report table, a new column will display the user role for each order or record.
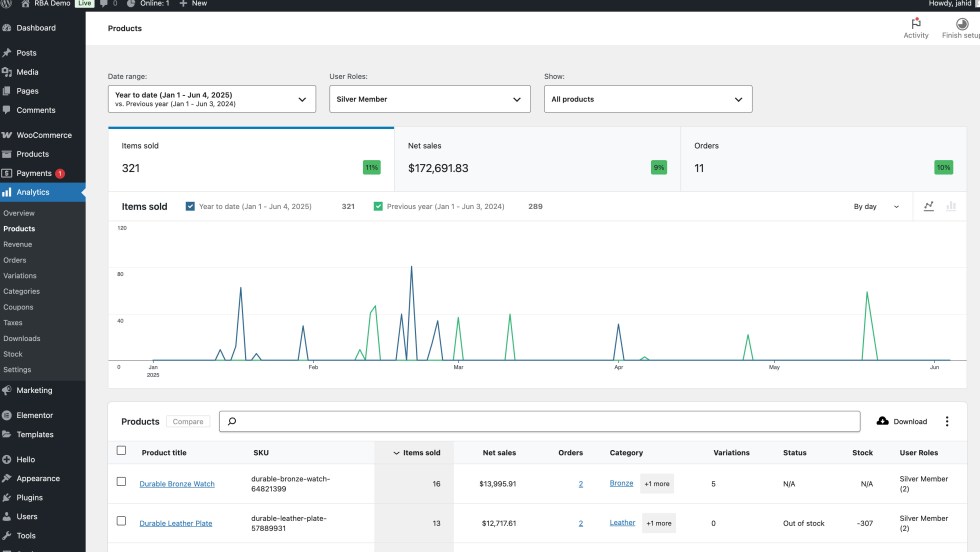
5. The same column will also be included in CSV exports for further analysis.

Example Use Case
↑ Back to topLet’s say you have two types of customers: Retail Customers and Wholesale Buyers (managed via custom WordPress user roles).
With this plugin, you can:
- Filter reports to see how much revenue comes specifically from the user role.
- Track the number of orders and average order value per user role.
- Export segmented data for use in external tools like Excel or Google Sheets.
Analytics and Reporting by User Roles
↑ Back to topRole Based Analytics for WooCommerce extends the default WooCommerce analytics by adding a User Role column and a User Role filter to key reporting screens. This allows you to analyze sales data by user role—without altering the core behavior of WooCommerce analytics.
Supported Report Screens
User Role-based reporting is available in the following sections:
- Products
- Orders
- Categories
- Coupons
- Downloads
Each of these screens now includes:
- A User Role column displaying a breakdown of performance by role.
- A User Role filter dropdown to view data for a specific role.
Understanding the Data
↑ Back to topBy default, all roles are shown in the User Role column—so you get an overview of how different user groups are interacting with your store.
- In Products, you can see how many times a product was purchased by each role.
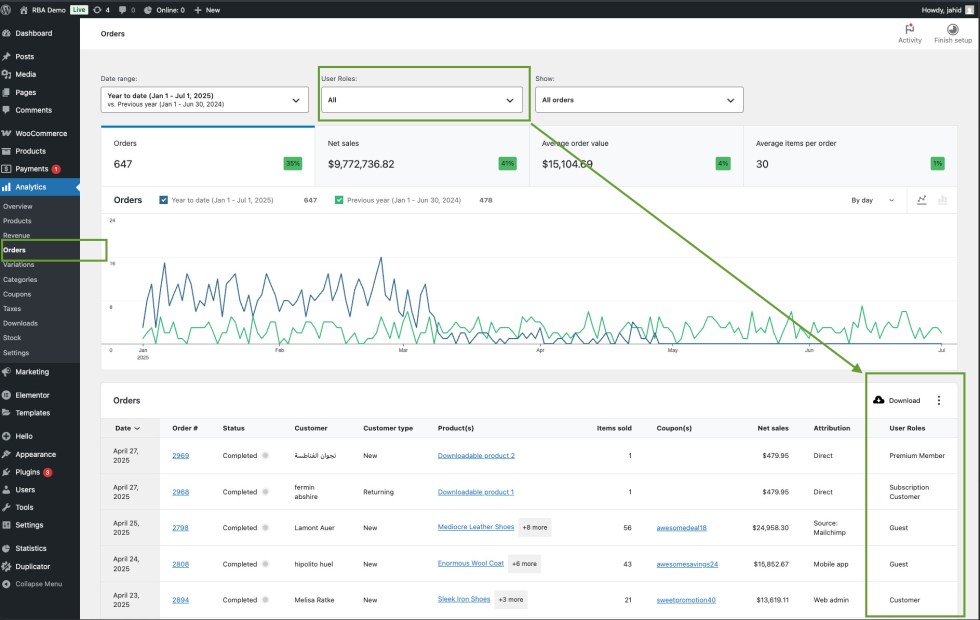
- In Orders, each row shows the role(s) of the customer who placed the order.
- In Categories and Coupons, usage is segmented similarly by role.
- In Downloads, each download record is tagged with the user’s role.
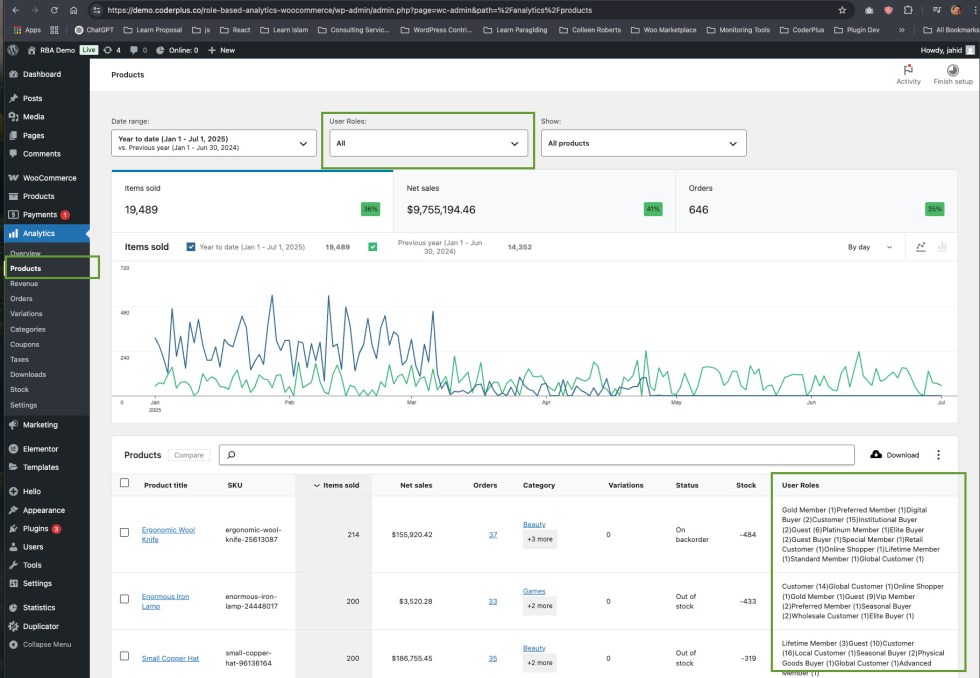
This gives you a clear view of customer behavior and role-based performance—even before applying filters.
Detailed User Roles Report Screens
↑ Back to topBelow is a breakdown of each enhanced analytics screen and how role-based data is presented.
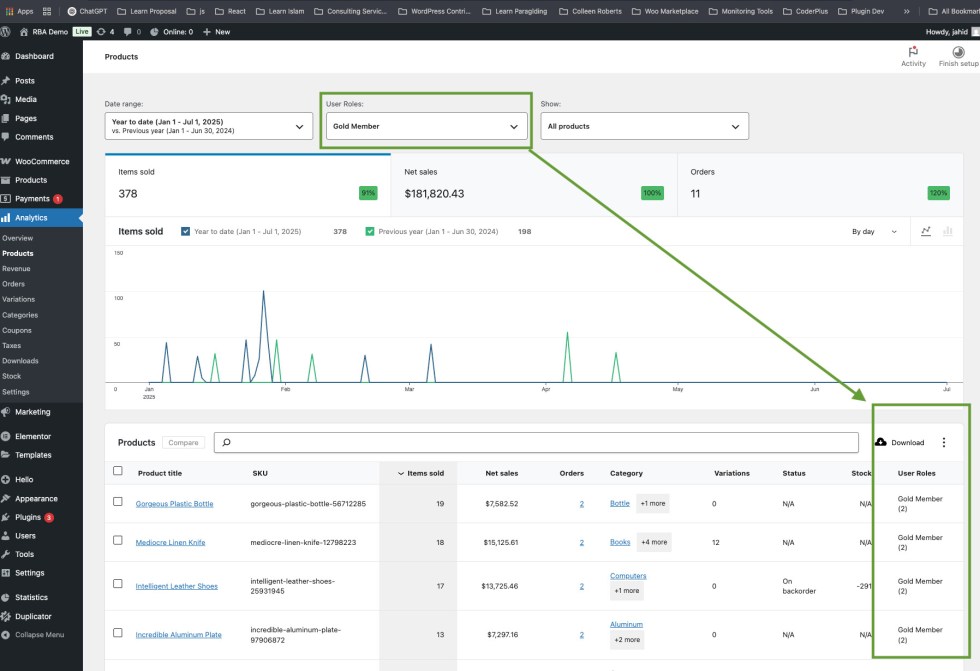
1. Products Report
↑ Back to topNavigation: WooCommerce → Analytics → Products
- Before filtering: All user roles with corresponding order counts per product are shown
- After filtering: Only products purchased by users with the selected role are listed

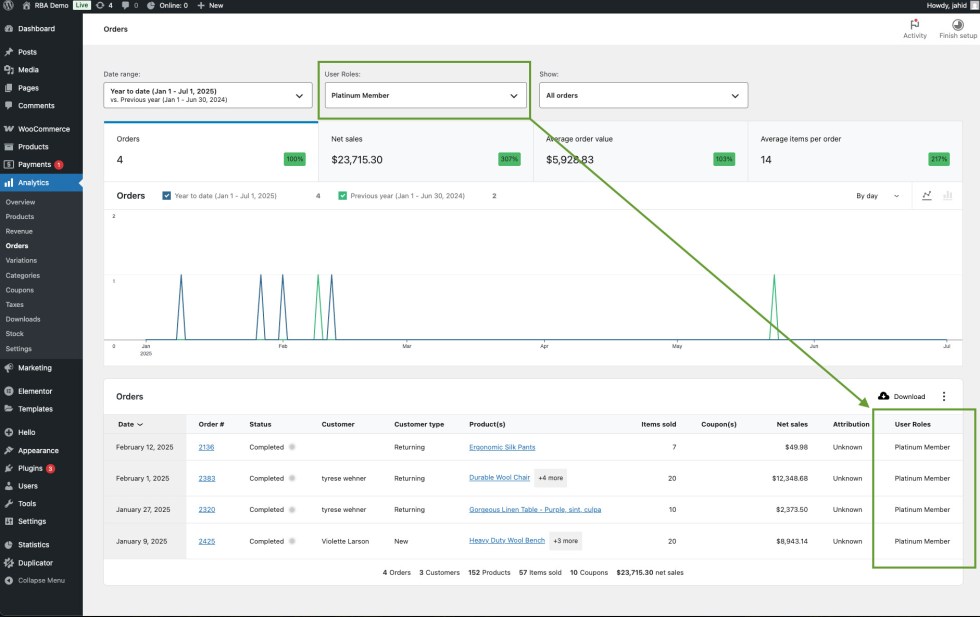
2. Orders Report
↑ Back to topNavigation: WooCommerce → Analytics → Products
- Before filtering: Shows all orders with the associated user roles of the customers.
- After filtering: Only orders placed by the selected user role are shown.
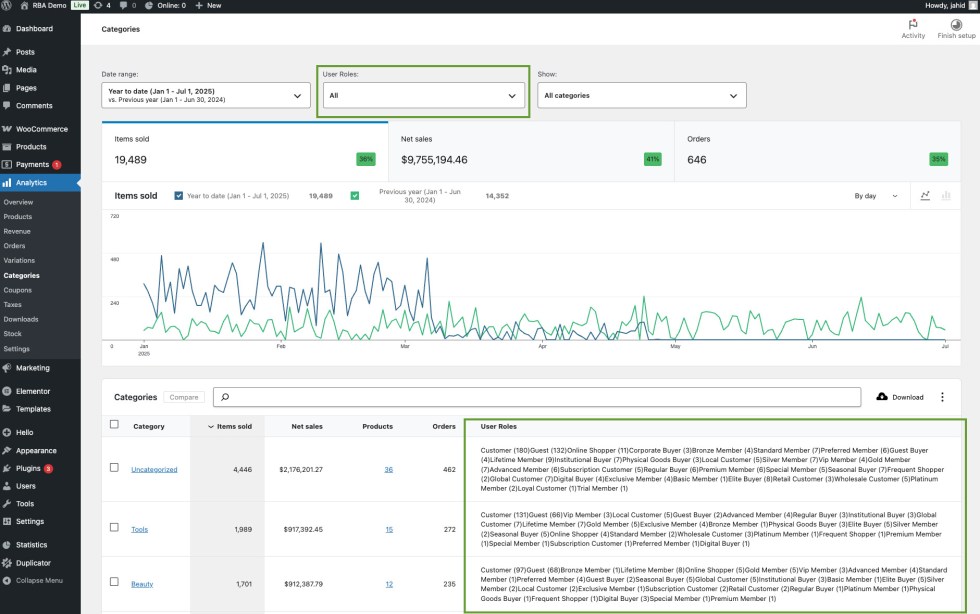
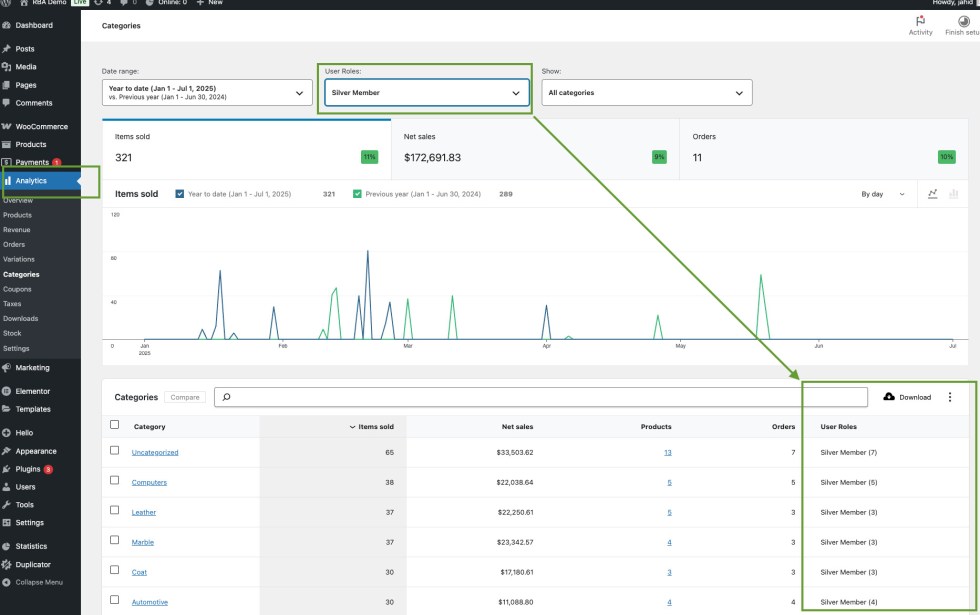
3. Categories Report
↑ Back to topNavigation: WooCommerce → Analytics → Categories
- Before filtering: Displays multiple roles and their order counts per category.
- After filtering: Only categories with purchases by the selected role are displayed.
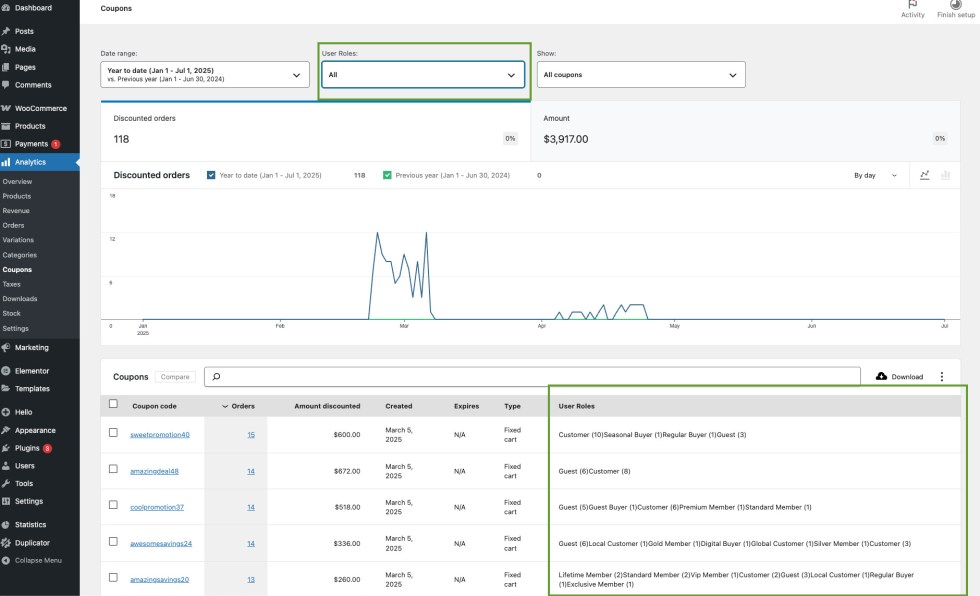
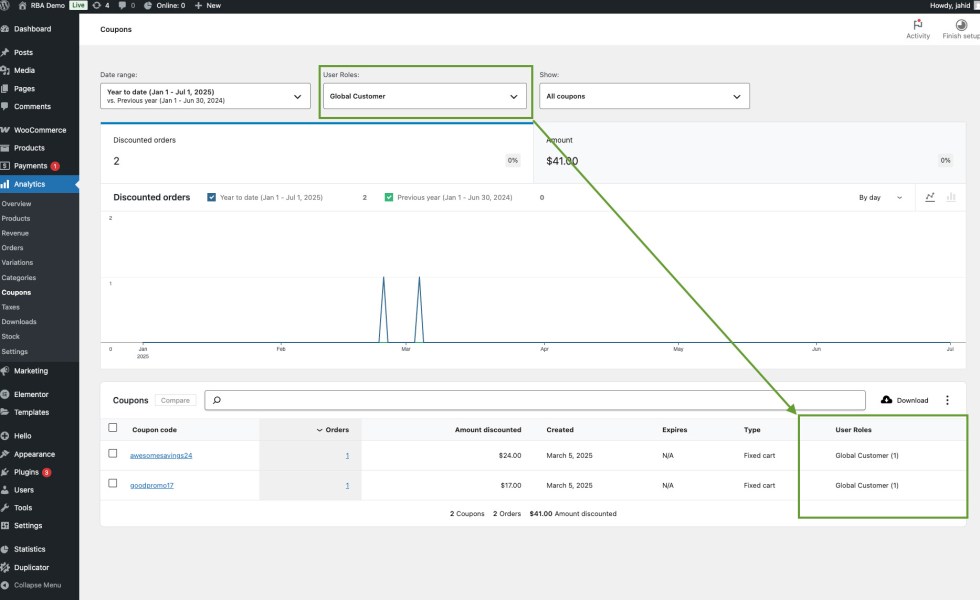
4. Coupons Report
↑ Back to topNavigation: WooCommerce → Analytics → Coupons
- Before filtering: Shows all roles that used each coupon, with usage counts.
- After filtering: Displays only the coupons used by the selected role.
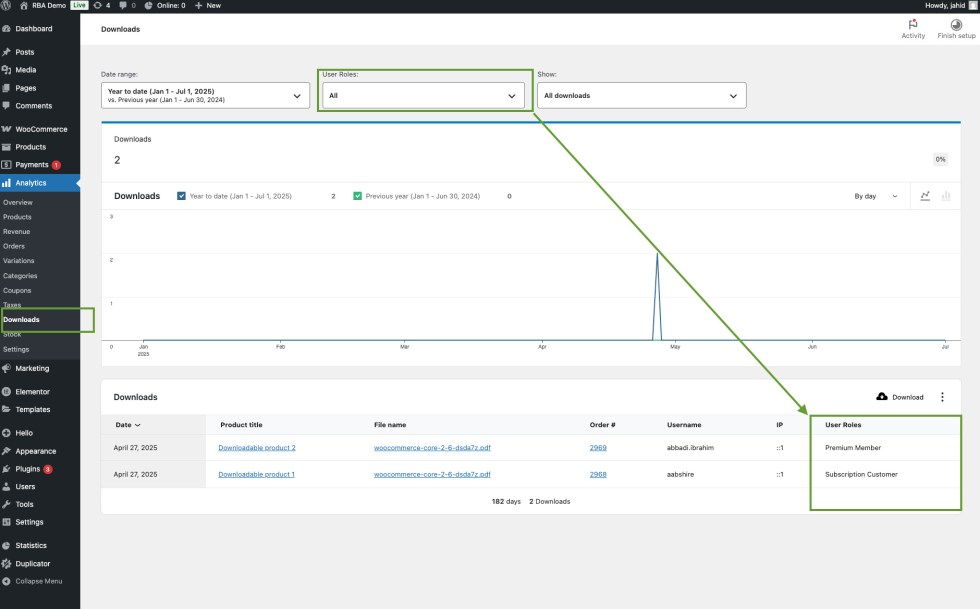
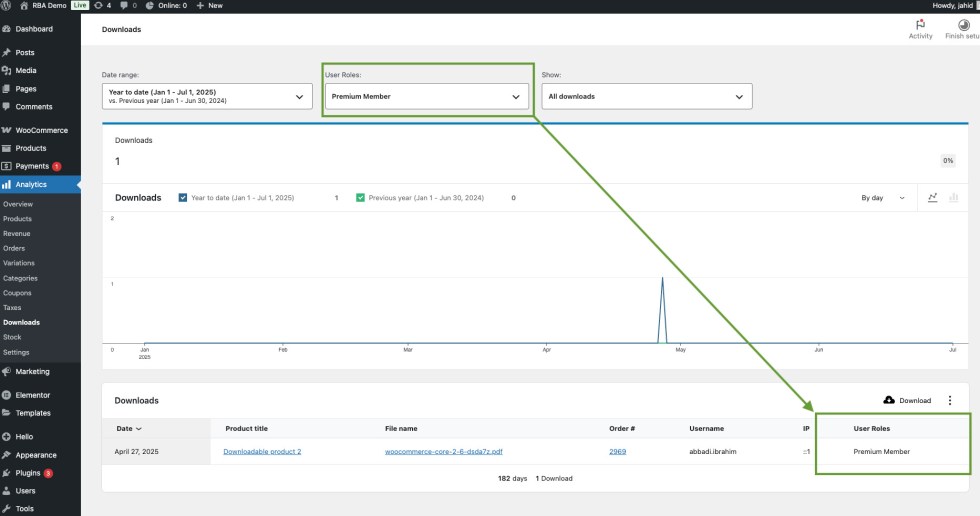
5. Downloads Report
↑ Back to topNavigation: WooCommerce → Analytics → Downloads
- Before filtering: Shows download activity for all user roles.
- After filtering: Only downloads by the selected role are displayed.
Troubleshooting
↑ Back to topIf you’ve made changes in the plugin settings but don’t see them reflected in the analytics reports, try clearing the WooCommerce analytics cache.
To do this, go to:
WooCommerce → Status → Tools → Clear analytics cache.
This will force WooCommerce to regenerate the report data based on the latest settings and filters.
FAQs
↑ Back to top
1. Do I need to configure anything after installing the plugin?
No. The plugin starts working automatically after activation. However, you can customize the behavior using the settings under Analytics → Settings, such as excluding specific roles or renaming the user role column.
2. Why am I seeing the "Customer" role even when I disabled it in settings?
WooCommerce automatically assigns the Customer role to all users who make a purchase. If a user has no other role besides Customer, it will still appear in reports—even if “Show Customer Role in Report” is disabled.
3. What Is the "Guest" Role?
WooCommerce tracks purchases made by users who checkout without creating an account. These are automatically grouped as Guest in the reports. This helps you compare registered customers with unregistered (guest) shoppers and better understand your overall funnel.
Questions & Support
↑ Back to topHave a question before you buy? Please fill out this pre sales form.
Already purchased and need some assistance? Please check out our troubleshooting tips and frequently asked questions for common issues or contact support via the help desk if you need more help.

