The Variations Report provides insight into the sales performance of each Product Variation on your store.
All Variations View
↑ Back to topBy default, the Variations Report displays the All Variations view. All Variations that have had sales in the specified date range will be shown.

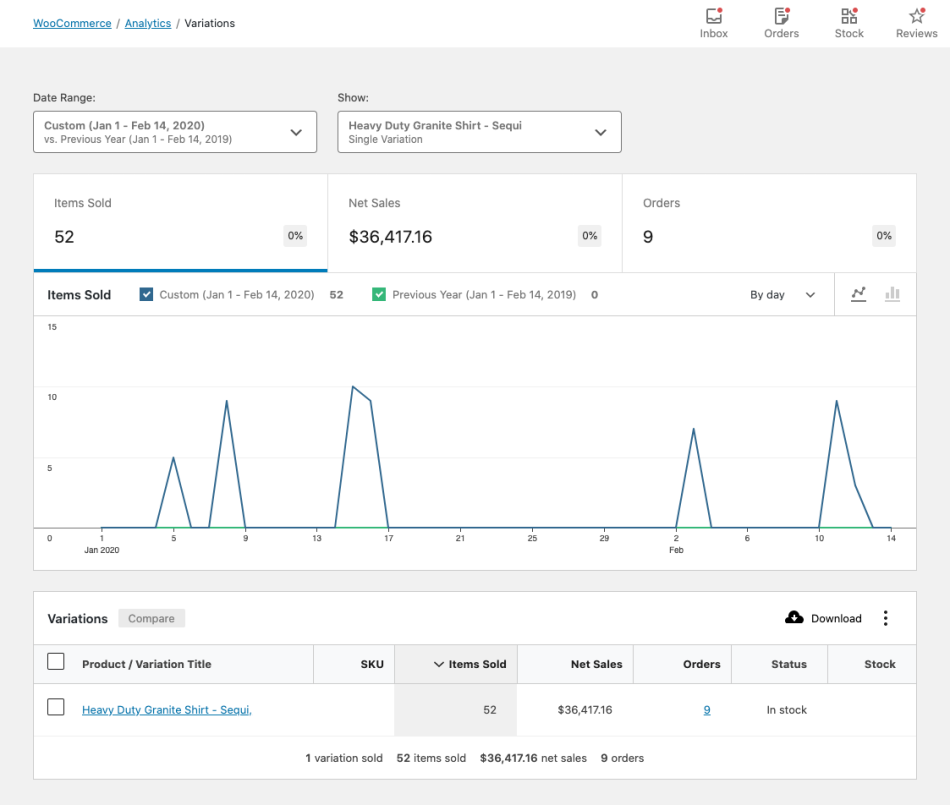
Single Variation View
↑ Back to top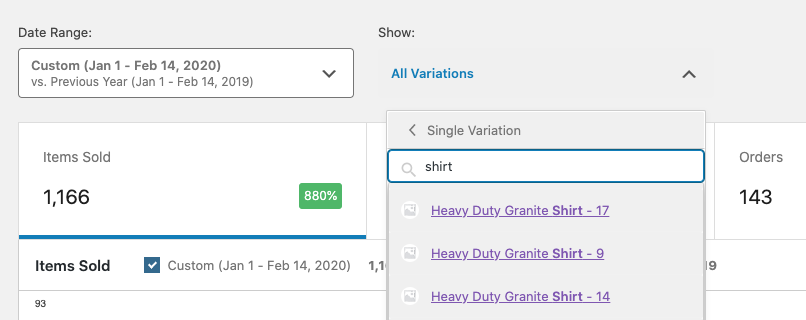
By selecting “Single Variation”, you can search for a single variation to display report data for.
Comparison Mode
↑ Back to top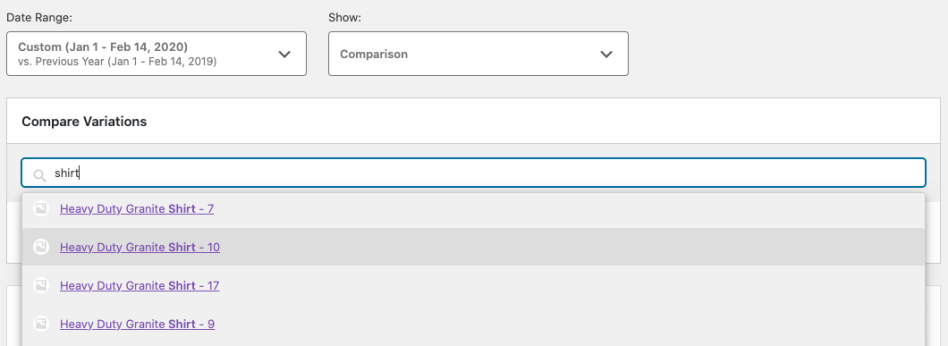
By selecting “Comparison”, you can search for multiple variations to display report data for.
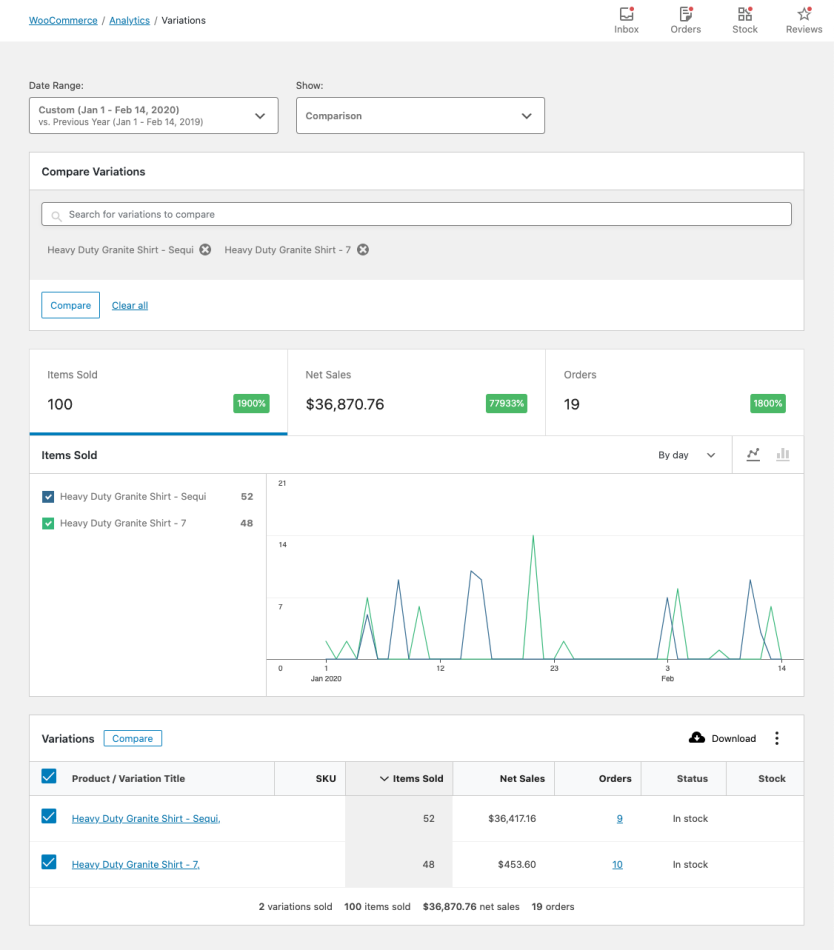
You can also use the checkboxes in the report table to select variations for comparison. Click “Compare” in the table header to compare the selected variations.
Advanced Filters
↑ Back to topThe advanced filters allow adding multiple filters to the report. These filters can be applied in two ways:
- All – Variations must match all filters to be included in the report
- Any – Variations must match one or more filters to be included in the report
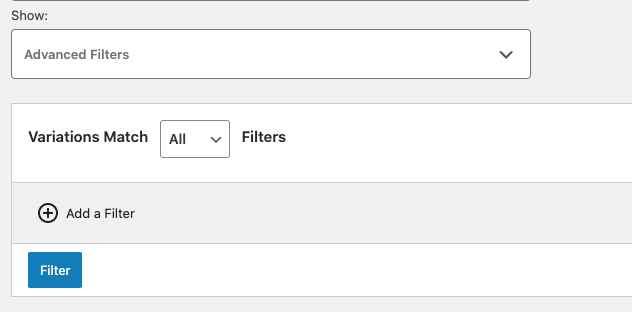
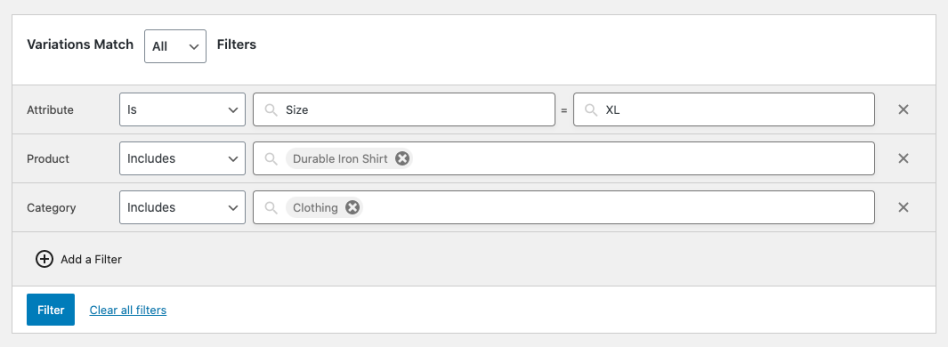
The following fields can be used for filtering:
- Attribute (can be used multiple times)
- Product (parent product)
- Category
Report Columns
↑ Back to topThe report table contains the following columns:
- Variation Title – links to Edit Product screen
- SKU
- Items Sold (count)
- Net Sales
- Orders (count) – links to Orders Report filtered by Variation
- Status (in/out stock)
- Stock (inventory quantity)
Report Sorting
↑ Back to topThe report table allows sorting by the following columns:
- SKU
- Items Sold (count)
- Net Sales
- Orders (count)
By default, the report sorts Variations by most items sold.
Clarifying Terms
“Net Sales” is calculated by subtracting refunds and coupons from the sale price of the variation(s).
As an equation, it might look like: (variation price * quantity) - refunds - coupons.