
The Revenue report shows how your store’s sales, returns, discounts, taxes, and shipping charges contribute to total revenue. Go to Analytics > Revenue to open it.
The date range uses the default selected under Analytics > Settings. You can choose another range and compare it with the previous period or previous year.
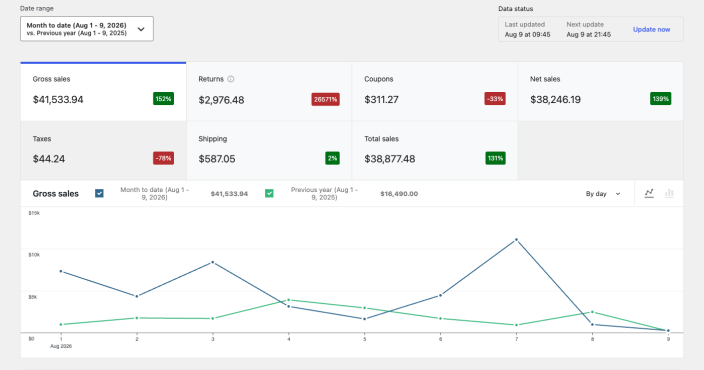
The performance indicators summarize Gross sales, Returns, Coupons, Net sales, Taxes, Shipping, and Total sales. When a comparison is active, each indicator also shows the percentage change. Select an indicator to change the metric shown in the chart.
Note:
For fully refunded orders, the refunded tax is included in the Returns amount. Net sales and Taxes do not include the returned amount.
Read the revenue table
↑ Back to topThe table beneath the chart includes one row for each interval in the selected date range, including intervals with no orders. The grouping changes with the date range and can be displayed by day or week.
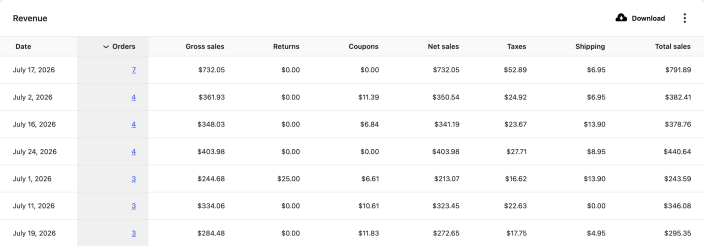
The table contains these columns:
- Date
- Orders
- Gross sales
- Returns
- Coupons
- Net sales
- Taxes
- Shipping
- Total sales
Select a column heading to sort the table. Select an order count to open the Orders report filtered to that interval.